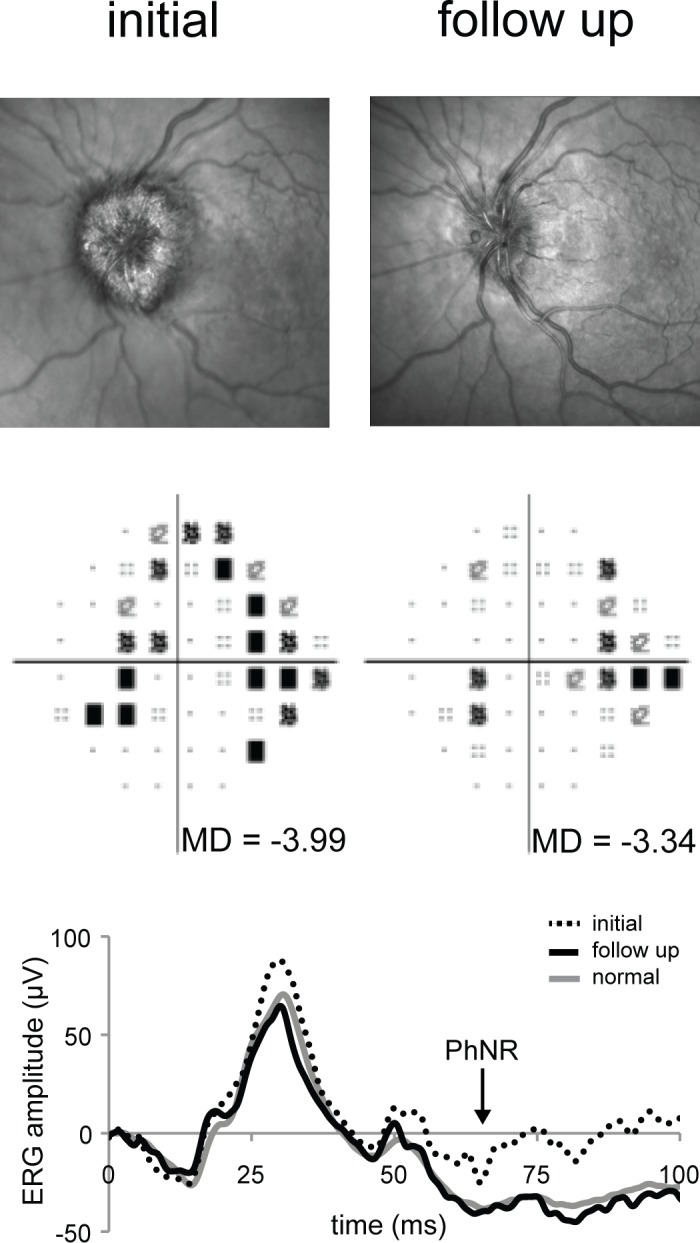
Figure 4.

Comparison of initial and follow-up observations for subject 8. The top row shows initial (left) and follow-up (right) optic disc appearance as documented using scanning laser ophthalmoscopy (Spectralis). The middle row shows initial (left) and follow-up (right), SAP total deviation plots and MD values (Humphrey SITA 24-2). Thee bottom graph shows the photopic single-flash ERG responses. The arrow shows the time at which the PhNR amplitudes were calculated.
