
Fig. 3.
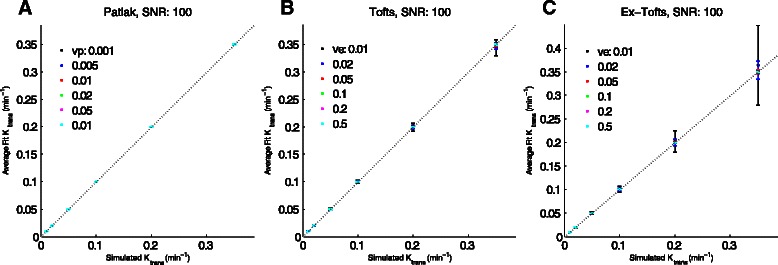
Ktrans fitting of simulated data. Simulated data with time resolution of 0.5 s and SNR = 100 were fitted using the same model used to generate the simulation with ROCKETSHIP using default settings for the Patlak method (a), Tofts (b) and Extended Tofts models (c). Ktrans simulated vs. fitted were plotted as a function of ve and vp. Dashed line is unity. Error bars denote standard deviation. Given the similar fits, points for different ve and vp may overlap. Concordance correlation coefficients for these (and other model fits) are shown in Tables 3, 4 and 5