
Fig. 4.
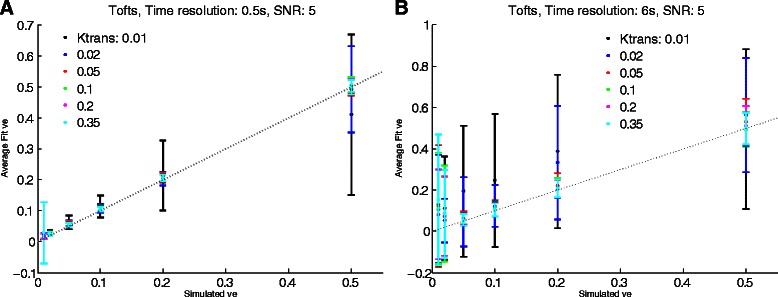
ve fitting at different time resolutions. Simulated data using the Tofts model were generated at SNR = 5 and at time resolutions of 0.5 s (a) and 6 s (b). Simulated vs. fitted ve were plotted as a function of Ktrans. Dashed line is unity. Error bars represent standard deviation. As expected, lower time resolution results in a high standard deviation of the curve fits. Given the similar fits, points for different Ktrans may overlap. Concordance correlation coefficients for these (and other model fits) are shown in Tables 3, 4 and 5