
Fig. 5.
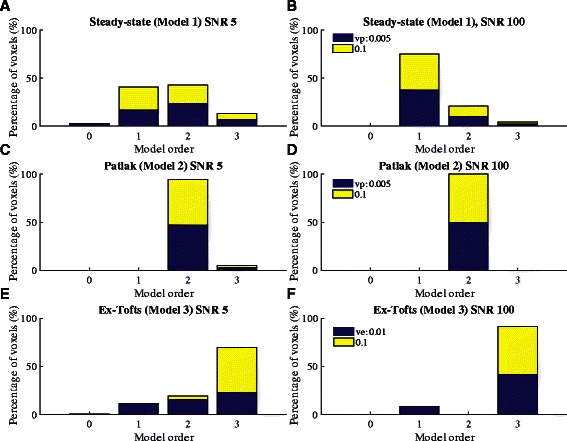
Nested model selection from simulated data. a and b show fitting for steady-state model simulated data. c and d show the fitting for Patlak simulated data. All the generated curves at SNR = 100 converged to the correct model. At lower SNR, some of the curves incorrectly converged to Model 3 (extended Tofts). e and f show fitting on extended Tofts simulated data. Again, the majority of the curves converged to the correct model. The percentage of voxels attributed to each model by the nest model algorithm is shown in Table 6