
Fig. 6.
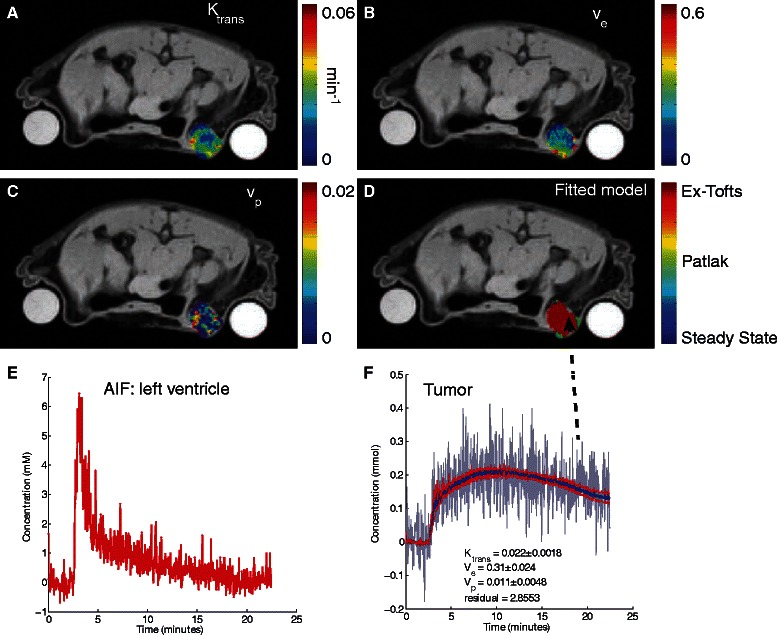
Nested model fitting of DCE-MRI data on a murine breast cancer tumor model. Parameters for Ktrans (a), ve (b), and vp (c) are shown. As shown in d, the majority of the voxels fitted best to the extended Tofts model, with some edge voxels fitting to the Patlak method. e shows the AIF used for the fit (taken from the left ventricle). f shows a sample time curve from the edge of the tumor (denoted by arrow) with corresponding fit (blue denotes the fit, red lines denote the 95 % prediction bounds for the fitted curve). Rod phantoms on either side of the mouse were present to allow for signal drift correction (not used in this case)