
Fig. 2.
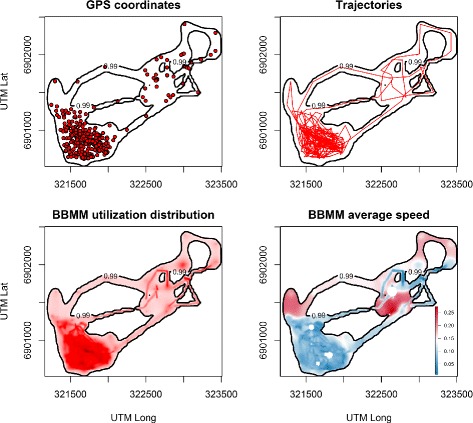
Spatial distribution of vervet monkey movement data. The Brownian bridge movement model takes the GPS fixes along the trajectories as input and is used to calculate a probability density distribution function of location (i.e. the utilisation distribution), but also a spatial distribution of a movement property like speed (red equals low, violet high speed). The black outline demarcates the 99 % volume isopleth