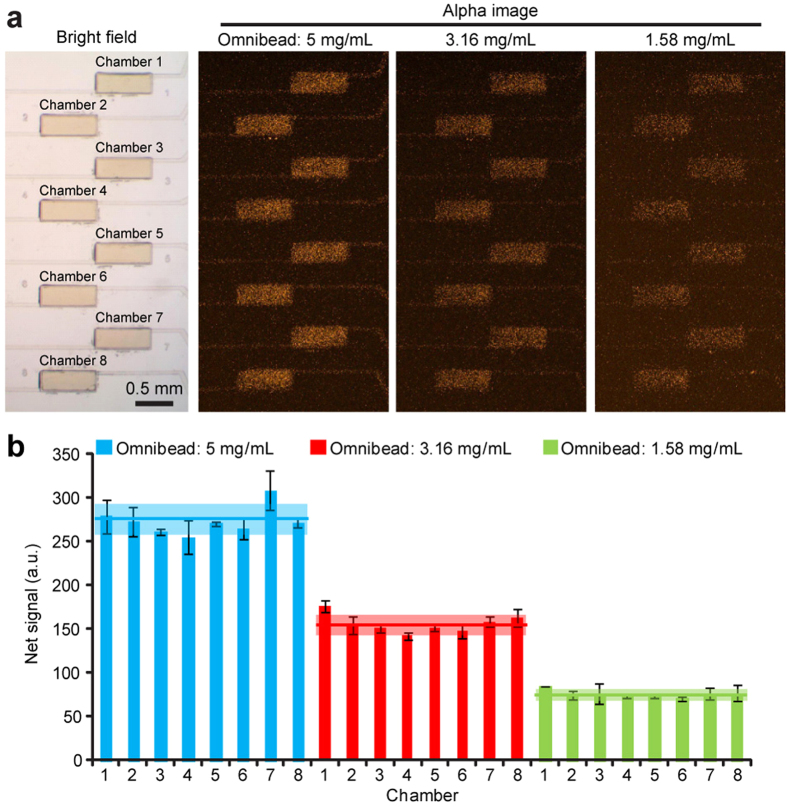
Figure 3. Biosensing uniformity of the microfluidic immunosensing chip.
(a) Brightfield (leftmost) and fluorescent (right) images showing the imaging chamber array filled with Omnibead solutions of three different concentrations, as indicated. (b) Bar plot of fluorescent signals detected simultaneously from all eight chambers of one imaging chamber array filled with Omnibead solutions of three different concentrations, as indicated. Data for each chamber represents the mean ± S.D., and n = 3. The mean fluorescent signal (colored line) ± S.D. (colored area) calculated for the whole chamber array were included in the plot.

