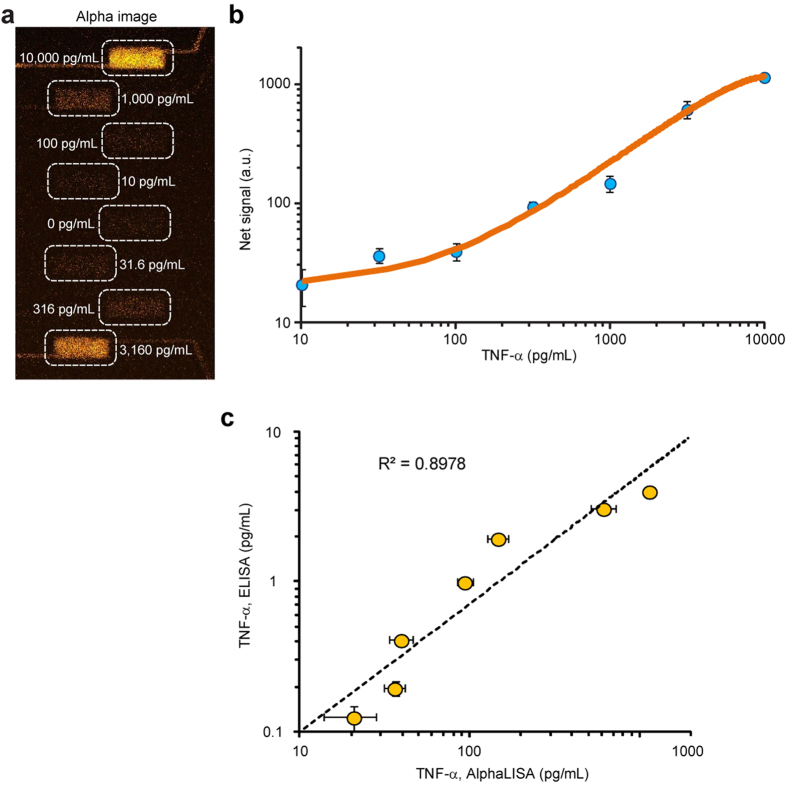
Figure 4. Standard calibration curve for TNF-α detection using the integrated microfluidic immunosensing chip.
To generate the standard curve, cell culture medium spiked with TNF-α were titrated to obtain eight different concentrations spanning a broad range from 0–10,000 pg mL−1. All eight samples were assayed simultaneously using the microfluidic immunosensing chip to obtain their corresponding fluorescent signals. (a) Representative fluorescent image showing the imaging chamber array filled with cell culture medium containing TNF-α of eight different concentrations, as indicated. Chamber areas were highlighted with white dashed rectangles to guide the eye. (b) Fluorescent signal as a function of TNF-α concentration. Note that data from 0 pg mL−1 TNF-α solution was not plotted. (c) Correlation between AlphaLISA performed in the microfluidic immunosensing chip and ELISA. Data represents the mean ± S.D. (n = 3 for AlphaLISA in the chip and n = 2 for ELISA).

