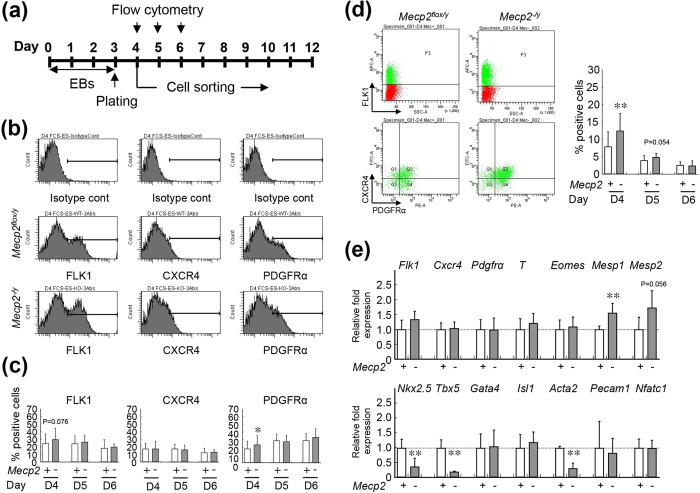
Figure 2. Isolation and characterization of wild-type and Mecp2-null ES-derived cardiovascular progenitors.
(a) Experimental schedule. ES cells were cultured in suspension for 3 days to form EBs, and then plated on gelatin-coated dishes. Flow-cytometric analysis and sorting of FLK1/CXCR4/PDGFRα-positive cardiovascular progenitors were performed on days 4, 5, and 6 after EB formation. (b) Detection of FLK1-, CXCR4-, or PDGFRα-positive cells in wild-type and Mecp2-null EBs by flow cytometry on day 4 after EB induction. (c) Percentages of FLK1 (left), CXCR4 (middle), or PDGFRα (right) positive cells in wild-type (white column; days 4, 5, and 6; n = 49, 17, and 11, respectively) and Mecp2-null (gray column; days 4, 5, and 6; n = 50, 17, and 11, respectively) EBs on days 4, 5, and 6. Bars represent the mean ± SD from at least 10 independent experiments (*p < 0.05). (d) Detection of FLK1/CXCR4/PDGFRα-positive cells by flow cytometry on day 4 after induction of wild-type (left) and Mecp2-null (right) EBs. The graphs show the percentage of FLK1/CXCR4/PDGFRα–positive progenitors in wild-type (white column) and Mecp2-null (gray column) EBs on days 4 (n = 40), 5 (n = 16), and 6 (n = 10). Bars represent the means ± SD from at least 10 independent experiments (**p < 0.01). (e) Marker gene expression in isolated progenitors on day 4 after induction of EBs. Expression levels of marker genes was measured by qRT-PCR in wild-type (white column) and Mecp2-null (gray column) isolated cells, and normalized against Gapdh. Each Gapdh-normalized mRNA level was further normalized against the corresponding mRNA level in the wild-type group. Data are shown as fold change relative to the wild-type group (defined as 1.0). Data are represented as means ± SD from five independent experiments (**p < 0.01).

