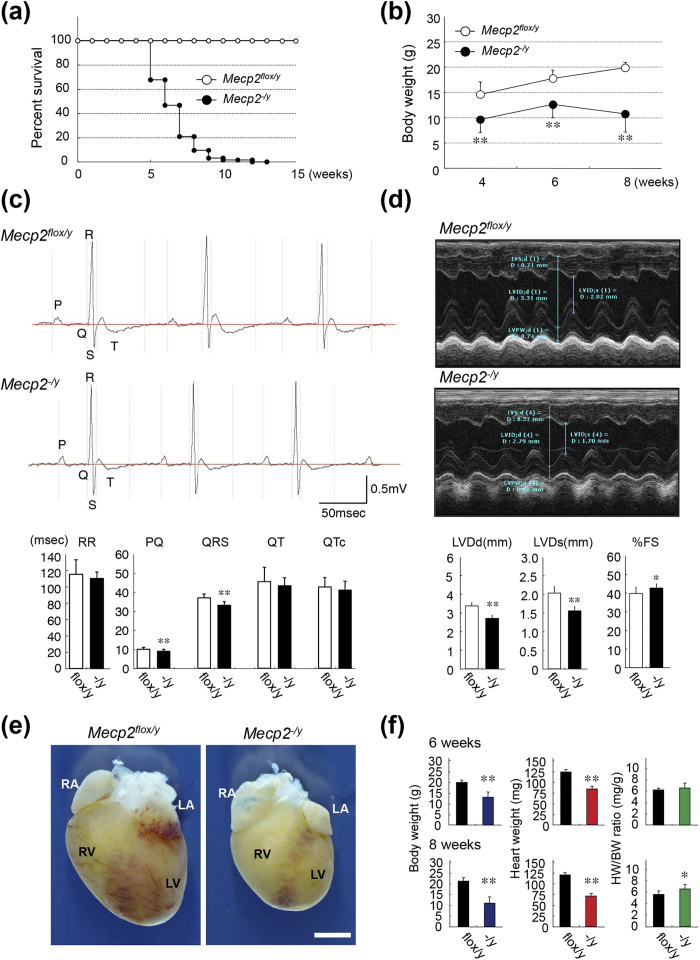
Figure 4. Phenotypic characterization of Mecp2-null mice.
(a) Kaplan–Meier survival curves for Mecp2-null mice. Litters including wild-type (Mecp2flox/y) and Mecp2-null (Mecp2−/y) pups were followed for 4–15 weeks after birth. Open circles, control wild-type mice (n = 30); closed circles, Mecp2-null mice (n = 62). Survival rates differed significantly between wild-type and Mecp2-null mice (p < 0.01, long-rank test). (b) Body weights in wild-type and Mecp2-null mice measured at the indicated times. Data are expressed as means ± SD. **p < 0.01, wild-type (4, 6, and 8-week-old; n = 12, 5, and 12) versus Mecp2-null (4, 6, and 8-week-old; n = 87, 82, and 61) mice. (c) Representative surface ECG from wild-type and Mecp2-null mice at 8 weeks. Graphs show mean time of RR, PQ, QRS, QT, and QTc intervals in 8-week-old wild-type and Mecp2-null mice. Data are expressed as means ± SD. *p < 0.05 and **p < 0.01, wild-type versus Mecp2-null mice. Mean values of electrocardiographic parameters are shown in Supplementary Table S2. (d) Representative M-mode echocardiographic tracings from 8-week-old wild-type and Mecp2-null mice. Graphs show mean values of LV end-systolic (LVDs) and -diastolic (LVDd) internal dimension and fraction shortening (%FS) in 8-week-old wild-type and Mecp2-null mice. Data are expressed as means ± SD. *p < 0.05 and **p < 0.01, wild-type versus Mecp2-null mice. Mean values of echocardiographic parameters are shown in Supplementary Table S3. (e) Hearts of wild-type and Mecp2-null mice at 8 weeks. Scale bars indicate 2.0 mm. (f) Body weights (g), heart weights (mg), and ratios of heart to body weight (mg/g) in wild-type (black column; 6- and 8-week-old; n = 7 and 7) and Mecp2-null (colored column; 6- and 8-week-old; n = 7 and 9) mice measured at 6 (top three graphs) or 8 (bottom three graphs) weeks. Data are expressed as means ± SD. *p < 0.05 and **p < 0.01, wild-type versus Mecp2-null mice.

