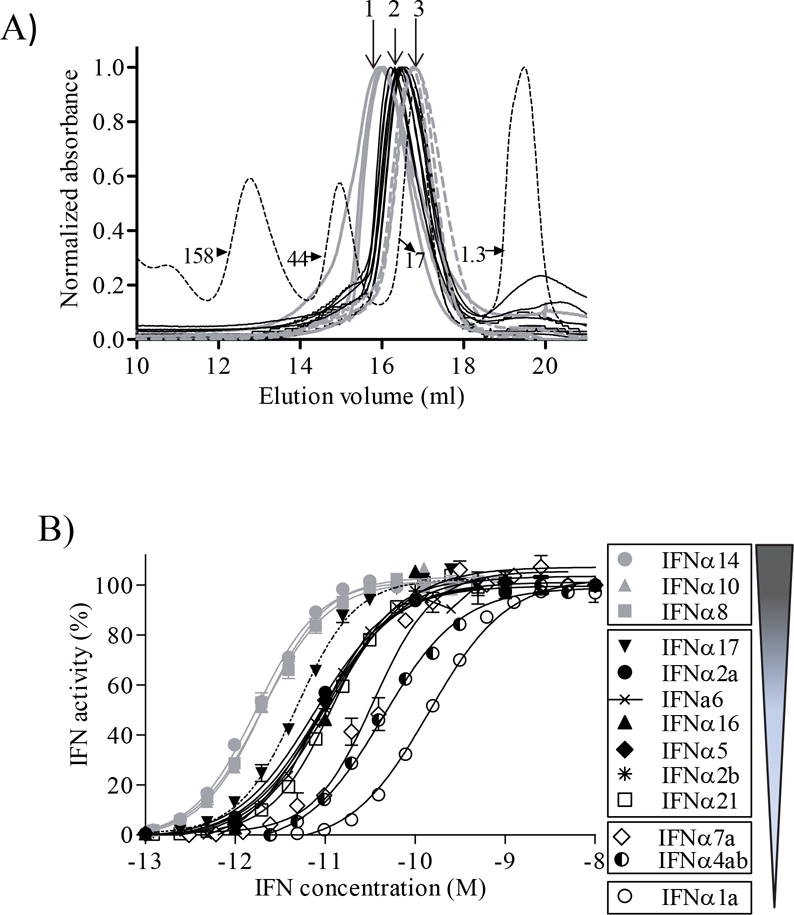
Figure 3. Biochemical and Functional Analysis of IFNα subtypes.

(A) Gel filtration chromatograms of the purified IFNα subtypes. Molecular weight standards are shown as a dashed line. The molecular weights of the peaks are labeled in kDa. IFNα chromatograms exhibiting similar profiles (3 different profiles, 1, 2, 3) are represented with the same line color/type study (1 = grey, 2 = black and 3 = dashed grey lines). (B) Average dose response curves for each IFNα subtype on HL116 cells. Graphical representation of the IFNα subtype potency groupings with lowest potency IFNαs at the bottom of the Figure.
