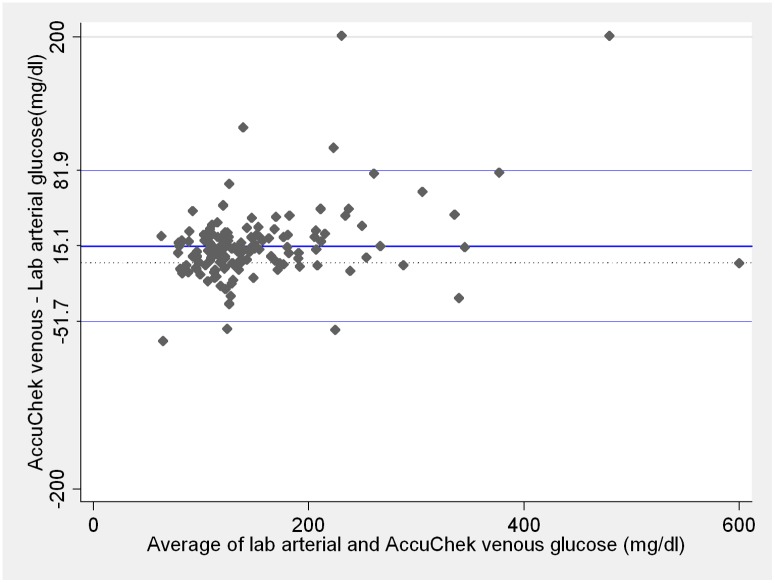
Fig 4. Comparison between central lab arterial and Accu-chek Advantage II venous blood glucose measurements.
Blue lines on the plot represent the mean difference and 95% limits of agreement. Dotted line represents zero. Lab and Accu-chek Advantage II measurements ≤ 10mg/dL were considered as 10 mg/dL and measurements ≥ 600 mg/dL considered as 600 mg/dL. These are the Accu-chek Advantage II limits of detection according to the manufacturer.

