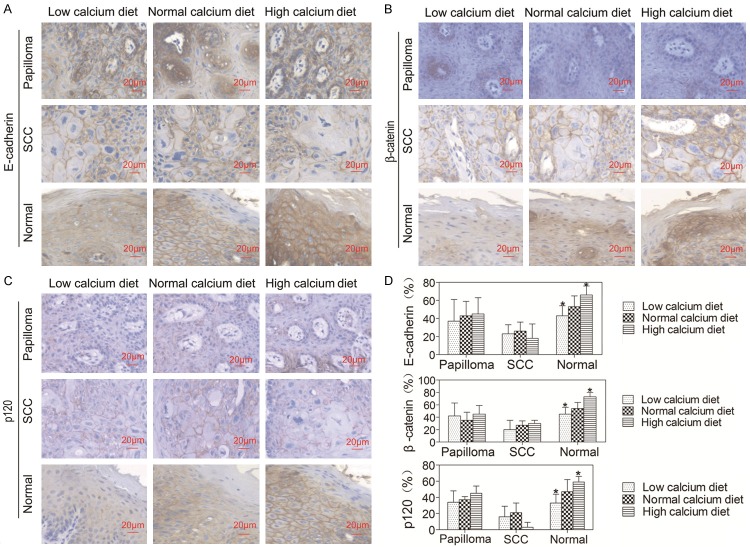
Figure 5.
Effects of dietary calcium on the expression of E-cadherin, β-catenin and p120 in the oral epithelium. The tongue was removed from the mice described in Figure 1 and the tissue was fixed in formalin solution and embedded in paraffin blocks for routine histological and immunohistochemical analysis using antibodies against E-cadherin, β-catenin and p120. Positive expression is shown in blown and the counterstaining is shown in blue. The representative section shows the average level of E-cadherin, β-catenin and p120 in oral papilloma, SCC and normal epithelium. Quantitation of E-cadherin, β-catenin and p120 in the cells is shown in the bar graph. The quantitation was obtained as described in Figure 3. The data are expressed as mean ± SD, *P < 0.05 (compared with the normal calcium diet group).

