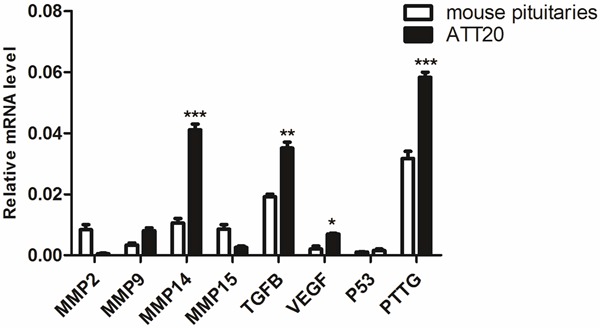
Figure 3.

Differential expression of MMP2, MMP9, MMP14, MMP15, TGFβ, VEGF, P53 and PTTG in ATT20 cell lines and mouse pituitaries. mRNA of relative factors was measured with real-time PCR. mRNA intensity was normalized against GAPDH. Relative changes in gene expression were measured using the 2-Δ C T method and relative quantitative comparison mRNA expression was taken mouse pituitaries as control. Three dependent results were presented as mean ± SD, *P < 0.05 was considered significant.
