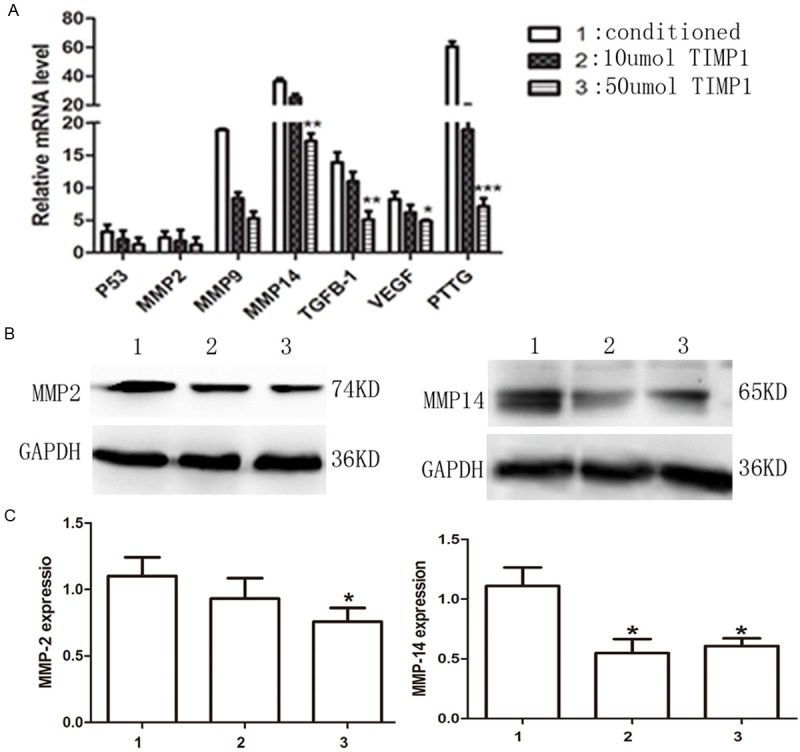
Figure 5.

Analysis of MMP2, MMP9, MMP14, TGFβ, VEGF, P53 and PTTG expression in TIMP1 treated cells and controls. A. mRNA expression of relative factors was measured with real-time PCR. B, C. MMP2 and MMP14 protein were measured with Western blot. *P < 0.05 was significant.
