
Figure 4.
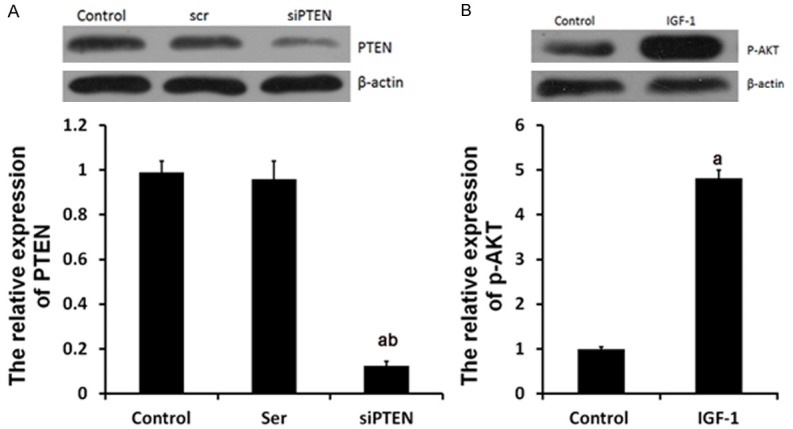
siPTEN and IGF-1 affected the expression of PTEN and p-AKT. Ser group, cells were treated with 50 nM scramble control siPTEN for 18 h. siPTEN group, cells were treated with siPTEN. IGF-1 group, cells were treated with IGF-1. Protein expression of PTEN (A) and p-AKT (B) were examined by western blot analysis, respectively. aP<0.01 vs. control group, bP<0.01 vs. Ser group.