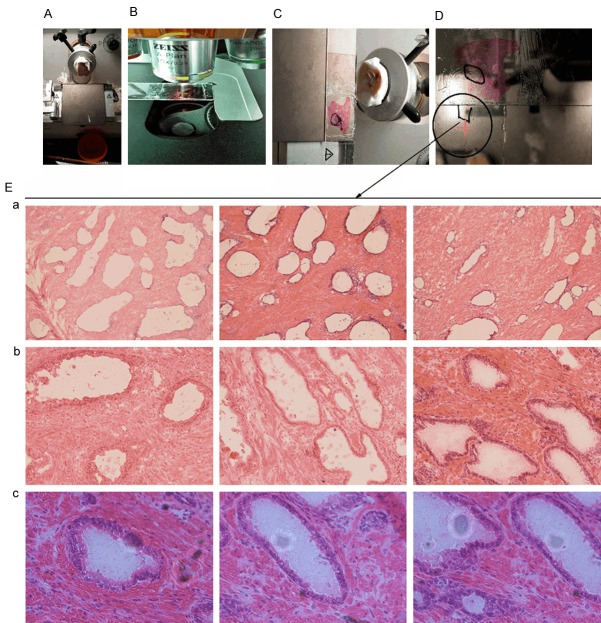
Figure 2.
A schematic diagram showing the isolation of PIA by manual microdissection. A: Tissue section size before cutting, B: H&E staining of 6 μm-thick slices to locate PIA, C: The identification of PIA after H&E staining, D: Scheme of manual isolation of PIA clusters, E: Microscope images of PIA clusters after isolation. a: 100×, b: 200×, c: 400×.

