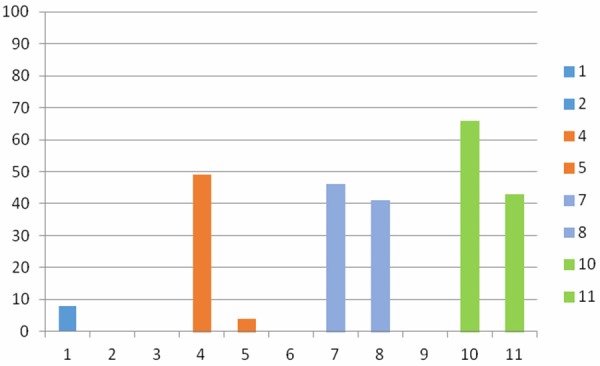
Figure 2.

Percentages of breast cancer patients and normal controls showing deficient levels of phosphorus, Mg, Ca and ionized calcium. 1: Percentage of breast cancer patients with deficient phosphorus levels. 2: Percentage of normal controls with deficient phosphorus levels. 4: Percentage of breast cancer patients with deficient Mg levels. 5: Percentage of normal controls with deficient Mg levels. 7: Percentage of breast cancer patients with deficient Ca levels. 8: Percentage of normal controls with deficient Ca levels. 10: Percentage of breast cancer patients with deficient ionized Ca levels. 11: Percentage of normal control with deficient ionized Ca levels.
