
Figure 1.
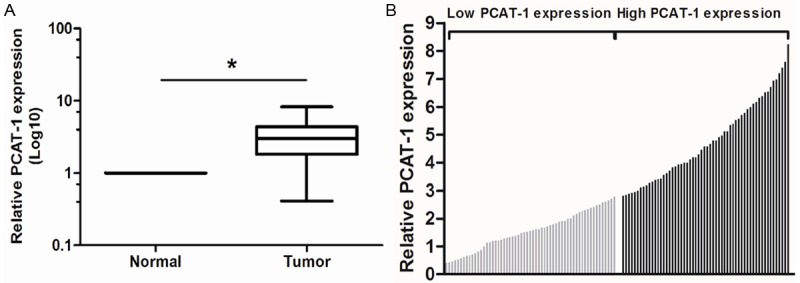
Relative PCAT-1 expression in HCC tissues and its clinical significance. A. Relative expression of PCAT-1 in HCC tissues in comparison with adjacent non-tumor tissues. PCAT-1 expression was examined by qRT-PCR and normalized to GAPDH expression. Data was presented as fold-change in tumor tissues relative to normal tissues. B. The 117 total HCC patients included in the study were divided into a low PCAT-1 group (n=58) and a high PCAT-1 group (n=59) according to the median value of relative PCAT-1 expression. *P<0.05.