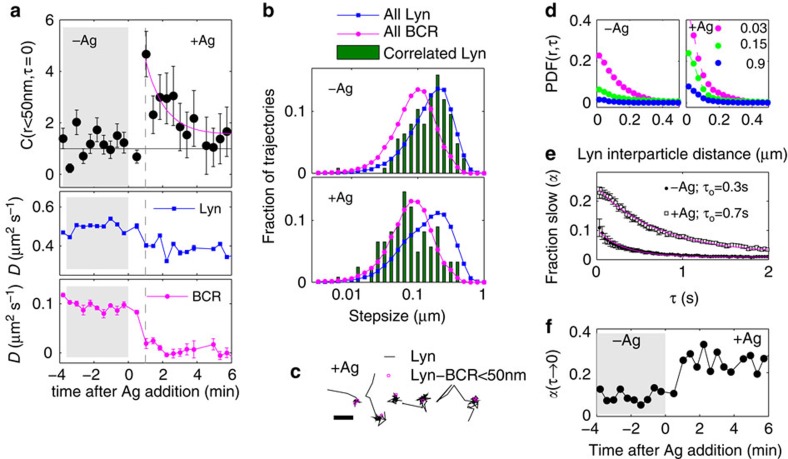
Figure 3. Correlation functions quantify the dynamics of BCR-Lyn co-localization in a single cell.
(a) C(r, τ=0) tabulated over 20 s steady-state time intervals both before and after stimulation with multivalent antigen for the single cell. The solid magenta line is meant to guide the eye and is not a fit to any theory. Increased BCR-Lyn co-localization is coincident with reductions in both BCR and Lyn average diffusion coefficients (D) extracted from single-molecule trajectories as described in Methods. Error bars in the top panel indicate σC, as calculated from equation (2). Error bars in lower two plots indicate the s.e. in determining average D as described in Methods. (b) Distributions of BCR and Lyn displacements between sequential image frames (τ=0.03 s) both before (−Ag) and after (+Ag) antigen stimulation for the single cell. Bars indicate the distribution of the subset of Lyn steps adjacent to localizations correlated with BCR satisfying C(r<50 nm, τ=0). (c) Representative Lyn trajectories imaged after antigen addition show that correlated Lyn localizations (red circles) are found as trajectories are transiently confined. Scale bar, 1 μm. (d) Probability distribution function (PDF) for correlated displacements occurring in a time window τ calculated over 4 min steady-state time intervals before (−Ag) and after (+Ag) antigen addition. Curves are fit to two Gaussian shapes (equation (4)) to extract MSD(τ) for each population as well as the fraction in the slower population (α(τ)) as described in Methods. (e) α(τ) decays with time and is well fit to a single exponential α(τ)=α(τ→0)exp(−τ/ τo) (magenta lines) with τo longer after antigen addition. Error bars indicate one s.d. in determining alpha from fits to the PDF. (f) An identical analysis conducted over 20-s steady-state time intervals shows the fraction of Lyn in the slowly diffusing pool as a function of stimulation time.

