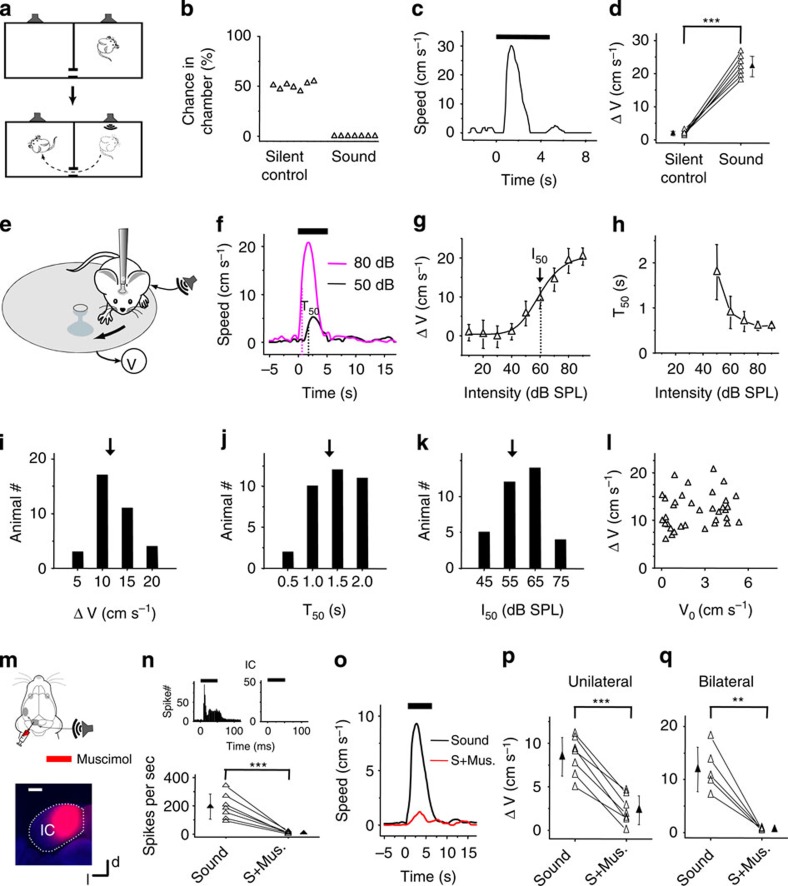
Figure 1. IC-dependent auditory-induced innate flight behaviour.
(a) Schematic graph for the flight behaviour test. When sound was played in the chamber the mouse stayed in, it quickly ran to the other chamber. (b) Percentage chance of animal staying in the chamber playing sound or silent sound 10 s after the trigger signal. N=7 animals. (c) Fleeing speed trace for an example animal. Thick bar marks the sound duration. (d) Averaged speed of all the tested animals (n=7). ***P<0.001, paired t-test. (e) Head-fixed preparation. Sound was delivered to one ear (with the other ear plugged). Running speed (V) was monitored in real time. (f) Average speed of an example animal (50 trials, inter-stimulus interval=30 s) in response to noise (marked by the thick bar) at two intensity levels. Dash vertical line marks T50. (g) Peak induced speed (average of 30 trials or more) versus noise intensity plotted for the same animal in (f). Dash vertical line marks I50. (h) T50 versus noise intensity for the same animal. (i) Distribution of average peak induced speeds (n=35 animals). Arrow marks the mean value. (j) Distribution of T50. (k) Distribution of I50. (l) Peak induced versus baseline speed. (m) Top, muscimol was injected into the IC contralateral to the sound source. Bottom, fluorescence image of a representative IC slice showing the spread of muscimol. Scale bar, 500 μm. d, dorsal; l, lateral. (n) Top, peri-stimulus spike-time histograms (PSTHs, 100 trials) for responses of an IC neuron to noise before (left) and after (right) muscimol injections. Bottom, average spike rates evoked by noise (80 dB SPL) before and after (S+ Mus.) muscimol injections for 7 IC cells in seven animals. Recording depths ranged from 250–800 μm. ***P<0.001, paired t-test. (o) Speed trace of an example animal before (black) and after (red) muscimol injections into the IC. (p) Summary of the peak induced speed before and after silencing the contralateral IC. ***P<0.001, paired t-test. N=7 animals. (q) Summary of the peak induced speed before and after silencing IC bilaterally. **P<0.01, paired t-test. N=5 animals. All error bars represent s.d.

