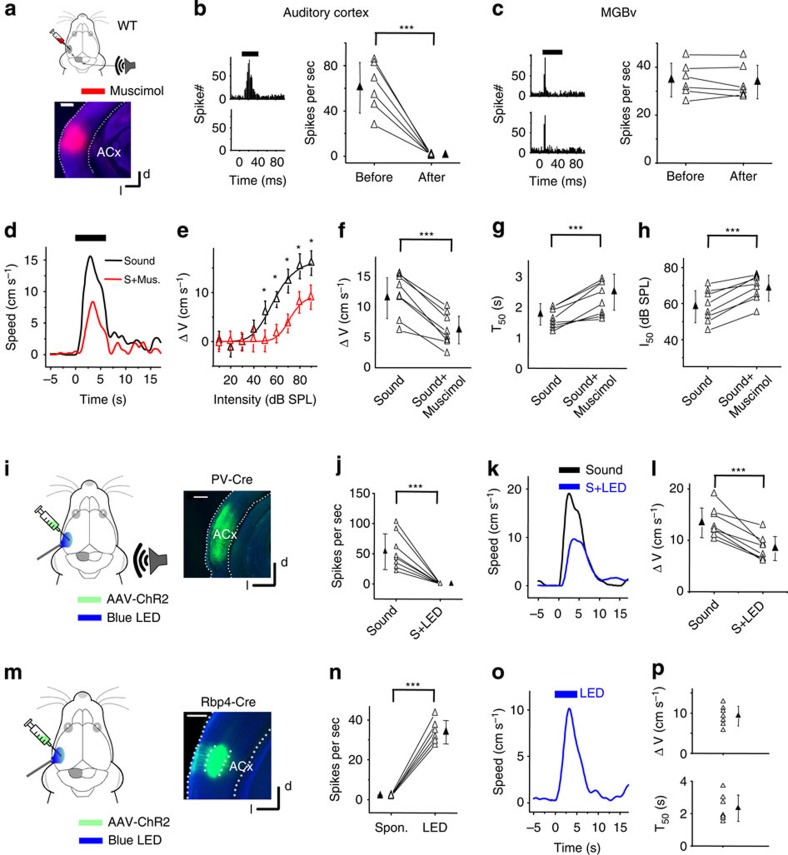
Figure 2. ACx mediates noise-induced flight behaviours.
(a) Top, experimental condition. Bottom, image showing spread of fluorescent muscimol. (b) Left, PSTHs (100 trials) for a cortical L5 neuron's responses to noise (80 dB SPL) before (upper) and after (lower) muscimol (Mus.) injections into the ACx. Right, summary of average spike rates evoked by noise. ***P<0.001, paired t- test. N=6 cells in six animals. (c) Left, PSTHs (100 trials) for an MGBv neuron's responses to noise before (upper) and after (lower) muscimol injections into the ACx. Right, summary of average evoked spike rates for six MGBv cells. ***P<0.001, paired t-test. (d) Speed trace for an example animal before (black) and after (red) muscimol injections into the ACx. (e) Peak induced speed versus noise intensity for the same animal. *P<0.05, two-sample t-test. (f) Summary of peak induced speed before and after silencing the ACx with muscimol. ***P<0.001, paired t-test. N=8 animals. (g) Summary of T50. ***P<0.001, paired t-test. N=8. (h) Summary of I50. ***P<0.001, paired t-test. N=8. (i) Top, experimental condition. Right, image showing ChR2 expression in the ACx. (j) Average spike rates of L5 neurons to noise (60 dB SPL) without and with LED illumination. ***P<0.001, paired t-test. N=8 cells in three animals. (k) Speed trace of an example animal in response to noise (black) and noise plus LED (blue). (l) Average peak induced speed without and with LED illumination. ***P<0.001, paired t-test. N=8 animals. (m) Top: experimental condition. Right, image showing fluorescence-labelled L5 neurons primarily in the primary ACx (A1). (n) Summary of spontaneous (Spon.) firing rates and average multiunit spike rates evoked by LED stimulation (50 ms pulse) in L5 of A1. ***P<0.001, one sample t-test. N=7 sites in seven animals. (o) Speed trace (average of 35 trials) of an animal in response to LED stimulation. (p) Top, summary of peak induced speed to LED stimulation. N=7 animals. Bottom, summary of T50. Scale bar, 500 μm. All error bars represent s.d.

