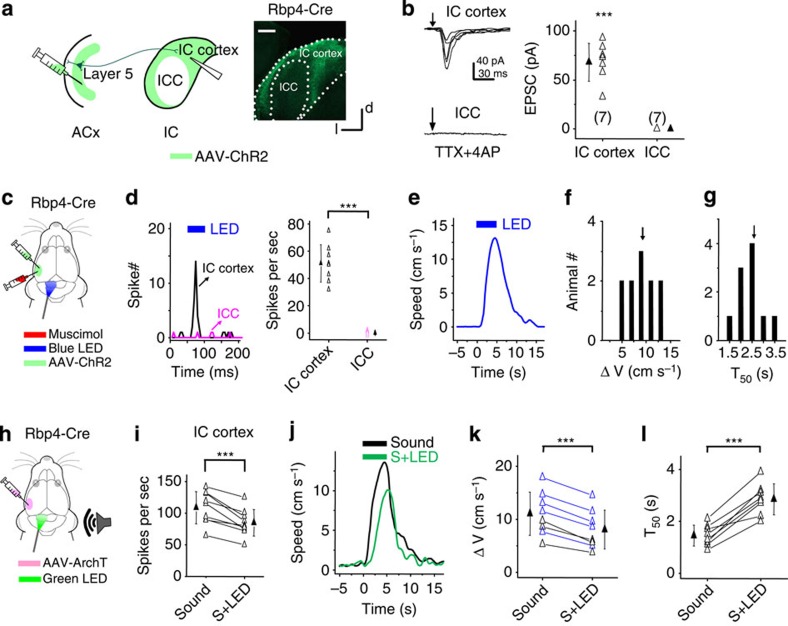
Figure 3. Involvement of corticocollicular projections.
(a) Left: experimental condition. Right, image showing distribution of corticofugal axons in the IC. Scale bar, 500 μm. (b) Left, EPSCs evoked by blue LED illumination (10 ms pulse) in an example ICx and ICC neuron, recorded under −70 mV. Arrow marks the onset of LED illumination. Right, summary of average EPSC amplitudes to LED stimulation. ***, different from zero, P<0.001, t-test. N=7 cells in each group. (c) In a head-fixed animal, blue LED light was applied to the IC surface to activate corticocollicular axon terminals with muscimol injected into the ACx on the same side. (d) Left, PSTHs (100 trials) of multiunit spike responses to LED illumination (blue bar) in an example ICx and ICC recording. Right, summary of average evoked spike rates. ***P<0.001, t-test. N=8 sites for each group. (e) Speed trace of an example animal in response to the LED illumination on the IC surface. (f) Distribution of peak induced speeds to LED stimulation (n=10 animals). (g) Distribution of T50. (h) AAV-ArchT was injected into the ACx of a Rbp4-Cre mouse. Six to eight weeks later green LED light was applied to the IC on the same side and contralateral to the sound source. (i) Average spike rates of ICx neurons evoked by noise without and with green LED illumination. ***P<0.001, paired t-test. N=9 cells in five animals. (j) Speed trace of an example animal in response to noise (black) and noise plus green LED illumination (green). (k) Summary of peak induced speeds without and with green LED illumination. ***P<0.001, paired t-test. N=8 animals. Blue symbol labels an individual animal for which there was a significant reduction in speed (P<0.05, t-test). (l) Summary of T50. ***P<0.001, paired t-test. All error bars represent s.d.

