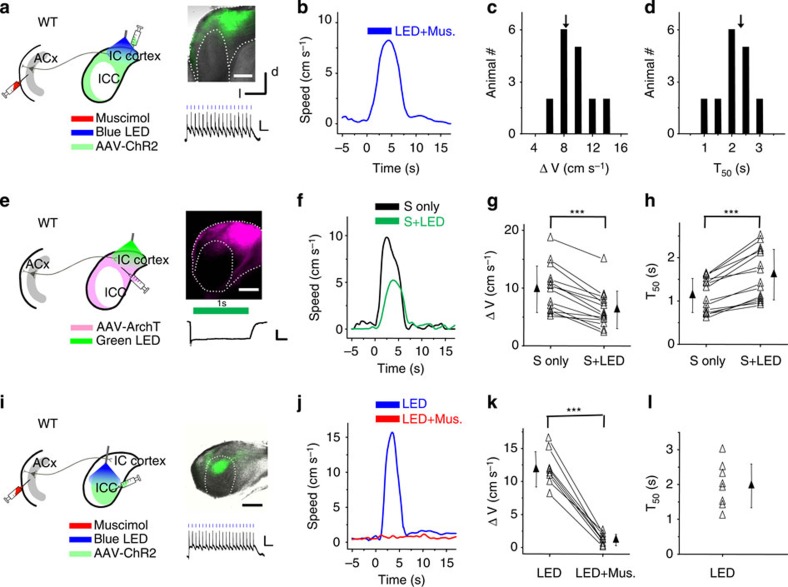
Figure 4. ICx mediates the noise-induced fleeing behaviour.
(a) Left, AAV-ChR2-EYFP was injected into the dorsal cortex of IC. Blue LED light was applied to the IC surface while ACx was silenced with muscimol (Mus.). Right top, fluorescence (green) image superimposed on the bright field image of an IC slice injected with AAV-ChR2. Right bottom, representative membrane potential response of a ICx neuron to pulses of LED illumination. Each blue line indicates one pulse. Scale bars, 25 mV, 200 ms. (b) Speed trace of an example animal to blue LED illumination on the IC surface. (c) Distribution of average peak induced speeds to LED illumination. N=17 animals. (d) Distribution of T50. (e) AAV-ArchT was injected into the dorsal cortex of IC. Green LED light was applied to the IC surface. Right top, fluorescence (pink) image of an IC slice injected with AAV-ArchT. Right bottom, representative membrane potential response of an ICx neuron to green LED illumination. Scale bar, 15 mV, 250 ms. (f) Speed trace of an example animal to noise (black) and noise plus green LED illumination (green). (g) Summary of noise-induced speed without and with LED illumination. ***P<0.001, paired t-test. N=14 test sessions from seven animals. (h) Summary of T50. ***P<0.001, Wilcoxon signed-rank test. (i) AAV-ChR2 was injected into the ICC. Blue LED was applied to the IC surface. The ACx later was silenced with muscimol. Right top, fluorescence (green) image of an IC slice injected with AAV-ChR2. Note that the fluorescence in the ICx was attributed to labelled axons from ICC. Right bottom, representative membrane potential response of an ICC neuron to blue LED pulses. Scale bars, 25 mV, 200 ms. (j) Speed trace of an example animal to blue LED illumination before (blue) and after (red) muscimol injections into the ACx. (k) Summary of average peak induced speeds to LED illumination before and after muscimol injections into the ACx. ***P<0.001, paired t-test. N=10 animals. (l) Summary of T50. Scale bar, 500 μm. All error bars represent s.d.

