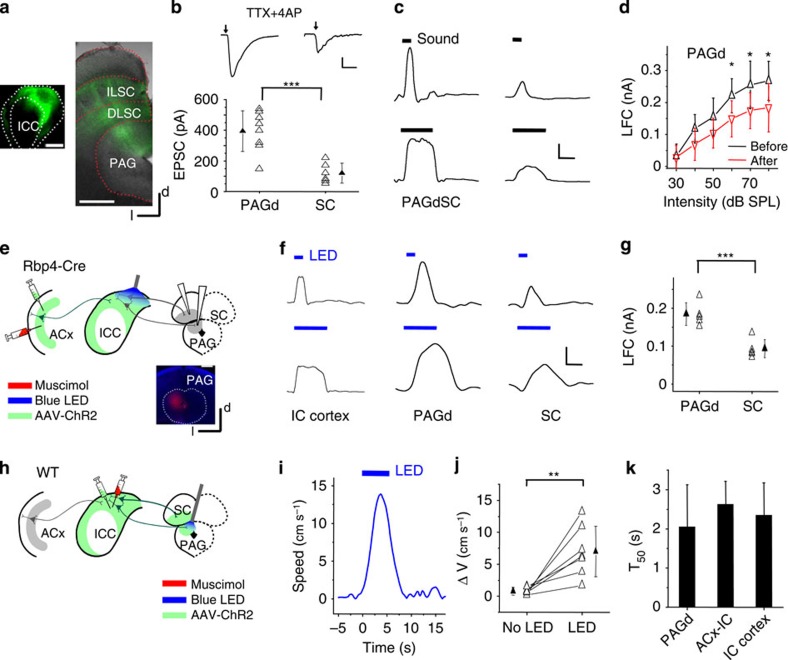
Figure 5. ICx drives the midbrain defense system.
(a) Confocal image of fluorescence-labelled axons from the ICx in the intermediate layer of SC (ILSC), deep layer of SC (DLSC) and dorsal medial PAG ventral to the SC. Left inset, injection site in the ICx. (b) Top, average monosynaptic EPSCs recorded in a representative PAGd (left) and SC (right) neuron to LED illumination of ChR2-expressing IC axons. Scale: 50 pA, 30 ms. Bottom, summary of average monosynaptic EPSC amplitudes in PAGd (n=8) and SC (n=6) neurons in slice recordings. ***P<0.001, two-sample t-test. (c) LFCs recorded in the PAGd and ventral SC in response to noise of different durations in an example animal. Scale: 0.1 nA, 100 ms. (d) Average amplitudes of evoked LFCs at different noise intensities recorded in the PAGd before and after muscimol injections into the ACx. *P<0.05, paired t-test. N=4 animals. (e) AAV-ChR2 was injected into the ACx of Rpb4-Cre mice. Blue LED was applied to the IC surface while ACx was silenced with muscimol. Recordings were made in the PAGd and ventral SC. Bottom, image showing injected fluorescent dextran after recording in the PAGd. (f) Sample LFCs evoked by LED pulses of different durations recorded in the ICx, PAGd and ventral SC, for an example animal. Scale: 0.1 nA, 100 ms. (g) Summary of average LFC amplitudes recorded in the PAGd (n=5 sites from 2 animals) and ventral SC (n=5 sites from 3 animals). ***P<0.001, two-sample t-test. (h) AAV-ChR2 was injected into the ICx. Blue LED was applied to the PAGd, while muscimol was injected into the ICx. (i) Speed trace of an example animal to blue LED illumination of the PAGd. (j) Summary of baseline running speed and average peak induced speed to LED illumination. **P<0.01, paired t-test. N=7 test sessions from 4 animals. (k) Summary of average T50 to stimulation of the PAGd, corticofugal axons in the IC and ICx neurons. No difference was detected. P>0.05, one-way analysis of variance test. All scale bar: 500 μm. All error bars represent s.d.

