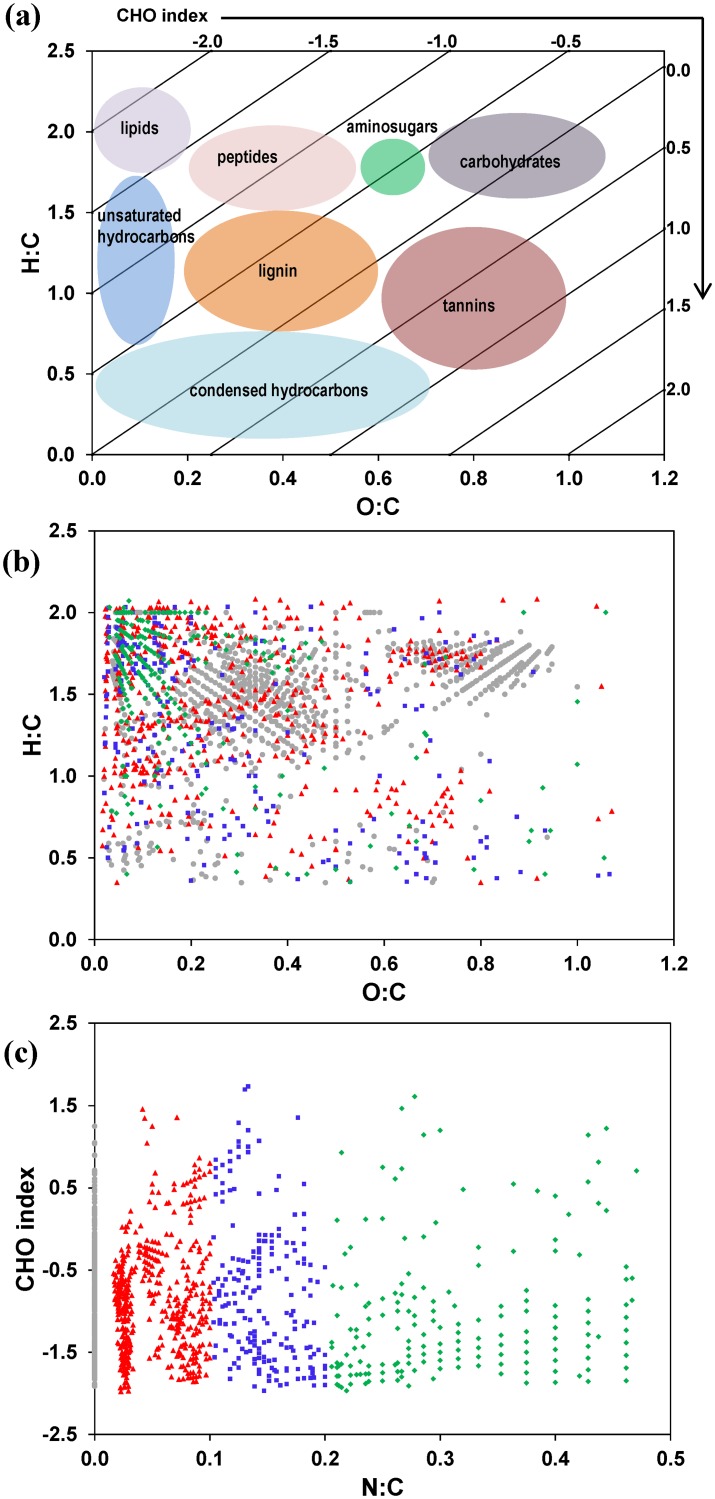
Fig 1. van Krevelen diagram of the compound classes associated with the H:C and O:C-coordinate plane and CHO Index plot with N:C coordinate.
(a) The CHO index, , is plotted along the top and right edges of the van Krevelen diagram to illustrate their relationships and associated compound classes of organic matter assigned by Kim et al. [42]. (b) Illustration of a van Krevelen diagram for a water-soluble SOM sample (WSF0) extracted from an Arctic soil. Colored symbols represent different molecular components plotted in (c), which is a CHO index plot with molecular components binned according to N:C ratio: N:C = 0 (gray circles), 0 < N:C ≤ 0.1 (red triangles), 0.1 < N:C ≤ 0.2 (blue squares), 0.2 < N:C (green diamonds); Compounds with similar N:C are localized to distinct regions of the van Krevelen diagram in (b).

