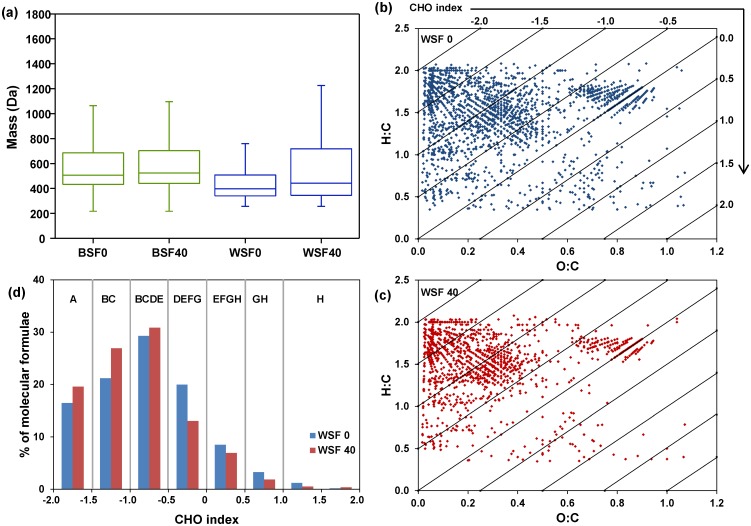
Fig 2. Molecular distribution of extracted SOM compounds from a 40-day soil warming incubation experiment.
(a) Box-and-whisker plots of the mass distribution of SOM compounds, including the base-soluble fraction (BSF) at day 0 (BSF0) and day 40 (BSF40) and the water-soluble fraction (WSF) at day 0 (WSF0) and day 40 (WSF40). (b and c) van Krevelen diagram along with CHO index showing the molecular distribution of WSF SOM compounds before (b) and after (c) incubation. (d) Percentages of molecular formulae identified with CHO index values between -2 and 2 before and after soil incubation and are normalized to the total number of formulae displayed in (b) and (c). Compound classes are labeled above colored bars as follows: (A) lipids, (B) unsaturated hydrocarbons, (C) peptides, (D) aminosugars, (E) carbohydrates, (F) lignin, (G) condensed hydrocarbons, (H) tannins.

