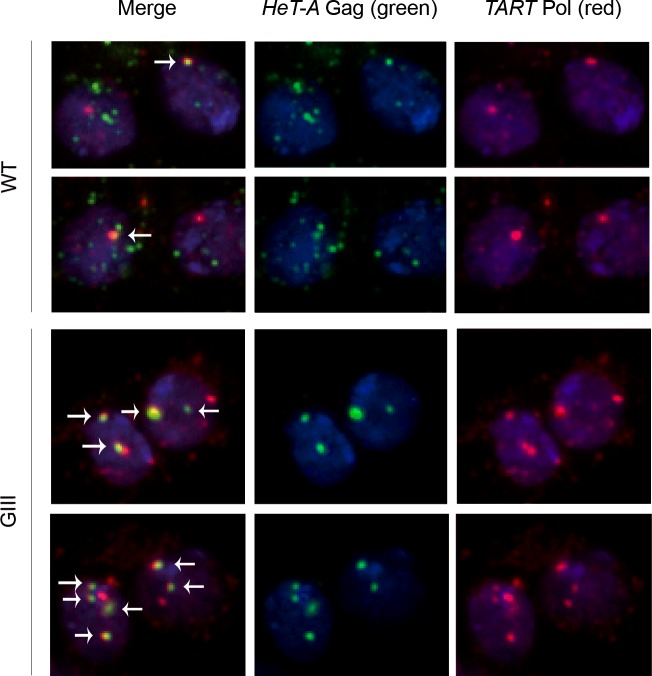
Fig 5. Localization of the HeT-A Gag and TART Pol proteins in wt and mutant neuroblasts.
Immunofluorescence detection of HeT-A Gag (green) and TART Pol (red). DNA stained in blue. First column (at left): merge of the three channels. Second column (middle): HeT-A Gag (green). Third column (at right): TART Pol (red). First and second row: wt neuroblasts. Third and fourth row: GIII neuroblasts. Arrowheads indicate co-localization of HeT-A Gag and TART Pol (visible in yellow).

