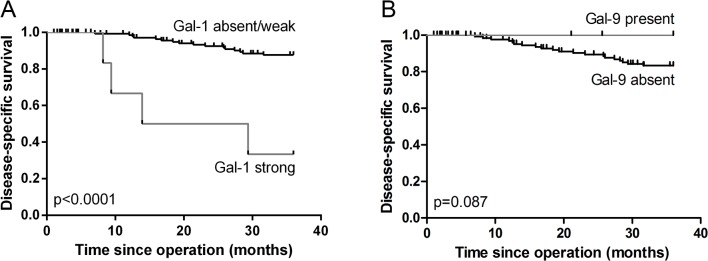
Fig 4. Survival analyses for galectin-1, -3 and -9 expression.

Kaplan-Meier survival curve for strong compared with absent to weak expression of galectin-1 by tumor cells is shown in A. A survival analysis comparing patients with present versus absent tumor expression of galectin-9 is shown in B.
