
Fig. 4.
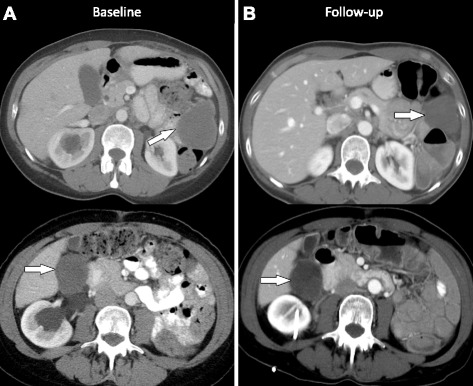
Imaging studies at baseline and follow-up. a Pre-treatment axial CT image shows a 6.2 × 5.1 cm peritoneal implant in the left upper quadrant (top) and a 4.4 × 4 cm peritoneal implant in the right hepatorenal space (bottom). b Follow-up axial CT image shows interval decrease in the peritoneal implant in the left upper quadrant which measures 4.5 × 3.8 cm, previously 6.2 × 5.1 cm (top). Axial CT image shows that the 4.4 × 4 cm peritoneal implant in the right hepatorenal space (bottom) has not changed much in size (measured 4.4 × 3.7 cm), but the lesion has now become less dense. This is an important observation as this represents response to therapy. Radiologists and clinicians should be aware that many targeted therapies may not result in significant change in size particularly during the early stages but may cause interval decrease in vascularity; on CT, this may be seen as decrease in density of the target lesions and represents response to therapy