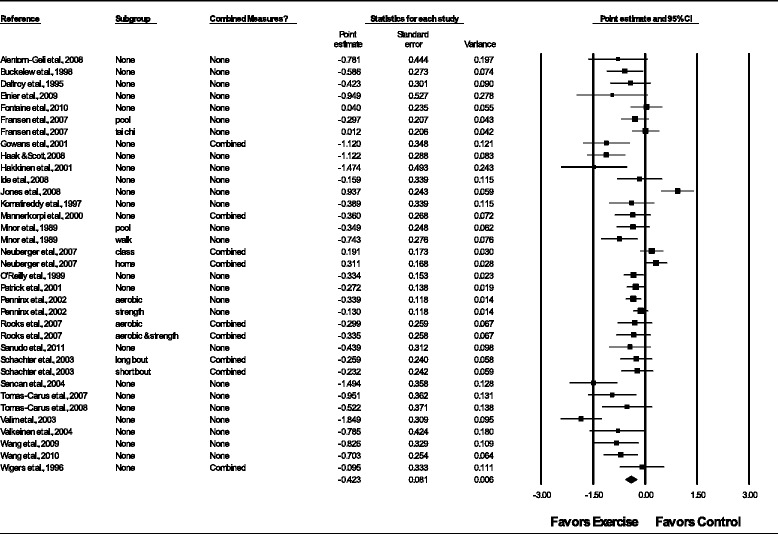
Figure 3.

Forest plot for changes in depressive symptoms. Forest plot for point estimate changes in depressive symptoms. The black squares represent the mean difference while the left and right extremes of the squares represent the corresponding 95% confidence intervals. The middle of the black diamond represents the overall mean difference while the left and right extremes of the diamond represent the corresponding 95% confidence intervals. Combined measures represent those studies in which multiple assessment instruments for depression and/or per-protocol and intention-to-treat analyses were merged.
