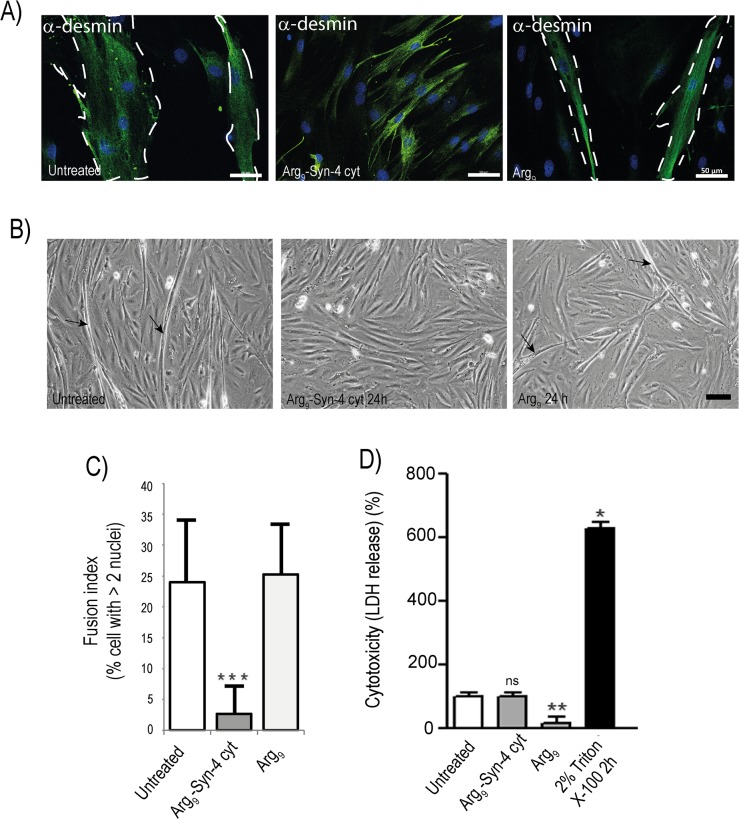
Fig 8. The cytoplasmic domain of syndecan-4 is involved in myoblast fusion.
A-B) Confluent muscle cells incubated without (left panel), or with either the cell-penetrating peptide Arg9-Syn-4 cyt (middle panel) or the cell-penetrating Arg9 control peptide (right panel) for 24 h in differentiation media. A) Fluorescence microscopy analysis of cells stained with anti-desmin (green) and DAPI (nuclei, blue) after fixation with 4% PFA. Scale bars: 50 μm. Dashed area show myotubes in untreated cells (left) and in cells treated with control peptide (right panel), but no myotubes are observed in cells treated with Arg9-Syn-4 cyt (middle panel). B) Light microscopy analysis of muscle cells treated as in A. Arrows indicate myotubes in left and right panels (untreated cells and cell treated with the cell-penetrating Arg9 control peptide). Note that myotubes cultured in dishes will have a mixture of morphological characteristics, both branched and unbranched. It should be emphasized that the important observation in this experiment is the complete absence of myotubes in Arg9-Syn-4 cyt treated cells (Fig 8A and 8B, middle panels). Scale bar: 5 μm. C) The fusion index (FI) (the number of cells with more than 2 nuclei) was calculated based on scoring at least four randomly chosen regions with nuclei and myotubes stained as in A in three independent experiments. The FI was calculated as the percentage of total nuclei incorporated into myotubes. Asterisk denote significant differences between untreated and Arg9-Syn-4 cyt treated cells (**p<0.01, n>50 cells). Arg9 was used as a control peptide. D) Media from untreated muscle cells, muscle cells treated with Arg9-Syn-4 cyt and with Arg9 control peptide for 24 hours were subjected to LDH release analysis. Incubation with 2% Triton X-100 for 2 h was used as a positive control for the assay. Differences in release was tested by Mann Whitney U test (*p<0.05, n = 3–6). Error bars indicate SEM.

