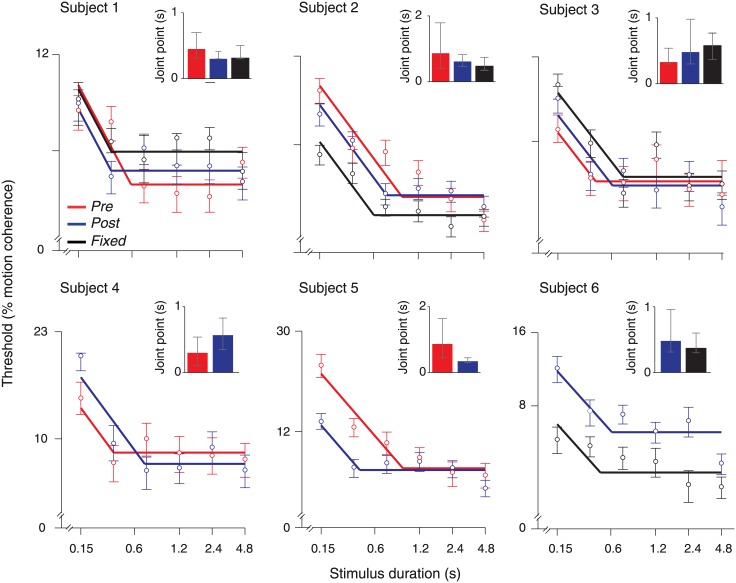
Fig 3. Model-independent characterization of integration timescales.
Threshold vs. duration functions from all conditions. Circles represent psychophysical thresholds for each stimulus duration. Solid lines: best fitting bilinear function, with the slopes constrained to -0.5 (first branch) and 0 (second branch; see text for details). Error bars, 60% confidence intervals (bootstrap). Inset: bar graphs of the joint point estimates of the best fitting bilinear function. Error bars, 95% confidence intervals (bootstrap).

