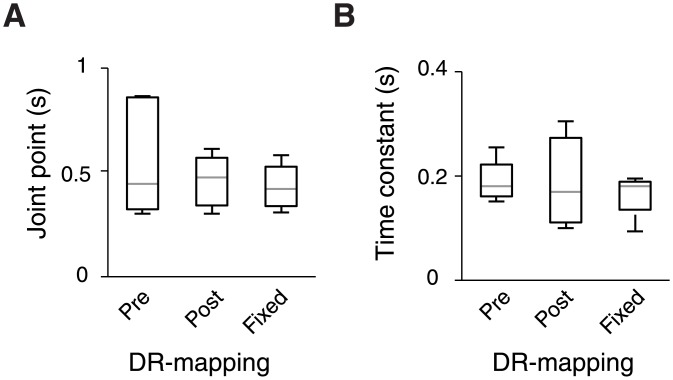
Fig 5. Summary of integration times using model-independent (A) and model-based (B) characterization of time-constants.
Summary of integration times under the three DR-mappings tested. The gray horizontal line marks the median, the upper and lower edges of the box mark the 25th and 75th percentiles, and the whiskers extend to the most extreme data points, excluding outliers. (A) Joint points of the bilinear fit to threshold vs. duration functions. (B) Time constants derived from LCA model fits.

