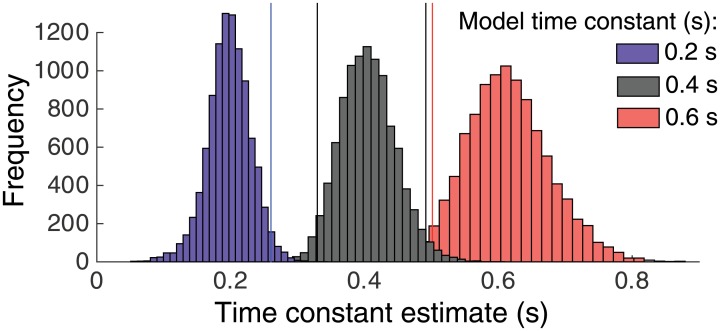
Fig 6. Sensitivity of the model-based timescale estimation.
Sensitivity of the model-based timescale estimation. Three distributions of estimated time constants obtained by simulating leaky integrator models with three different time constants (0.2, 0.4, 0.6 s). Vertical lines indicate the 2.5% and 97.5% quantiles. The overlap between the distributions is small (<5%).

