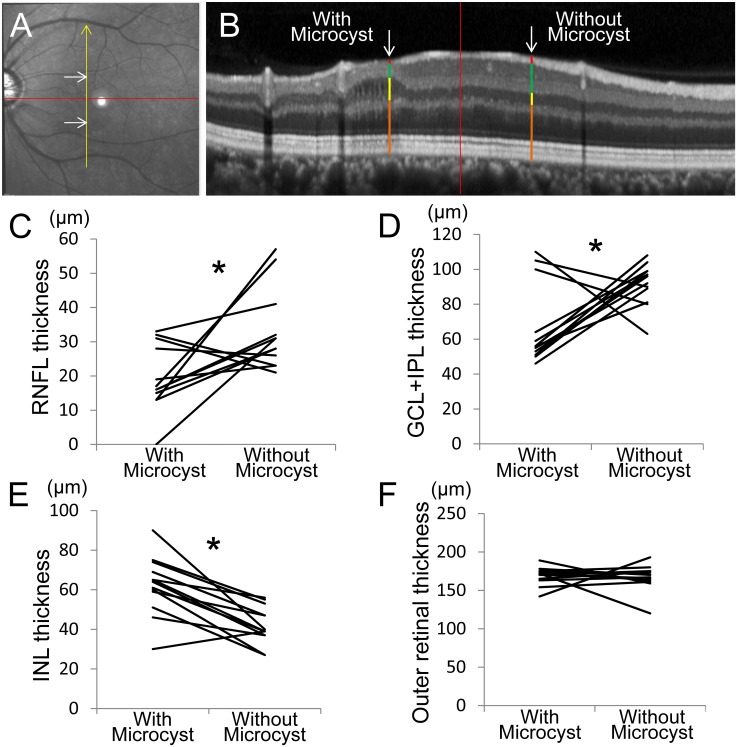
Fig 6. Comparison of retinal nerve fiber layer (RNFL), ganglion cell complex plus inner plexiform layer (GCC+IPL), inner nuclear layer (INL), and outer retinal thickness between at sites with and without microcystic changes.
Measurements were taken at the opposite and equidistant site from a horizontal line passing through the foveal center (red line in A) for sites with and without INL lesions. A, An infrared fundus image shows measurement points (white arrows). B, A Spectralis optical coherence tomography (OCT) image along the yellow arrow in A. The RNFL (red bars), GCL+IPL (green bars), INL (yellow bars) and outer retinal thickness (brown bars) measured at sites with and without microcystic lesions (white arrows) and are shown in parts in C, D, E and F, respectively.

