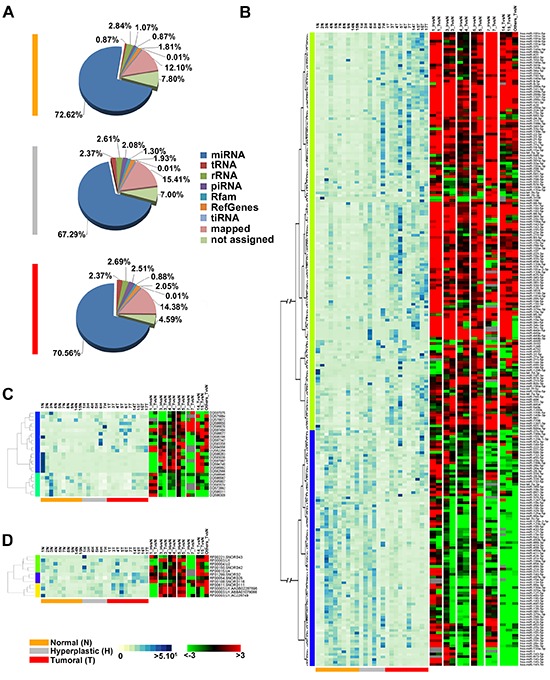
Figure 1. Changes in sncRNAs expression during endometrial carcinogenesis.

(A) Pie-charts showing the percentage of small non-coding RNA species identified in each tissue type by smallRNA-Seq. Heatmaps showing expression levels (RPM, left) with respect to the fold-change (FC) (right) for miRNAs (B), piRNAs (C) and snoRNAs (D) differentially expressed during carcinogenesis. Only sncRNAs with base mean read count ≥30 in at least 3 samples and with significant fold-change in at least 50% of patients (|FC| ≥1.5, p-value 0.05) were showed. Expression levels are displayed from white (low expression) to dark blue (high expression) while differentially expressed sncRNAs are displayed from green (under-expressed) to red (over-expressed). RNAs not differentially expressed in a given sample are in black; grey indicates missing data.
