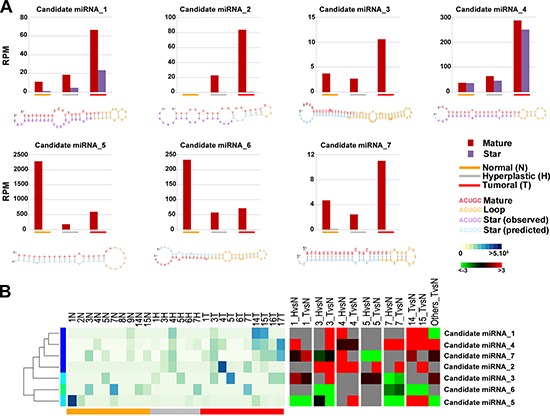
Figure 2. Novel miRNA candidates discovered by next generation sequencing.

(A) Number of reads found for each tissue type and secondary structures of the novel miRNAs. Histograms show the total number of reads sequenced for each histotype (normal: orange; hyperplastic: grey; tumor: red) and for each portion of the miRNA identified (mature: blue, loop: red and star: green). All novel miRNAs were computationally predicted to form stem-loop hairpin structures but each novel miRNA varied in the location, number and size of bulges. Putative secondary structures for the seven novel miRNAs discovered in this study are shown below the corresponding histograms. Red, yellow, blue and purple indicate respectively the mature sequence, the loop structure, the predicted star sequence and the star sequence when identified in our sequencing data. (B) Heatmaps showing the expression level (RPM) of 7 novel miRNAs (left) and the relative fold-difference for each patient (right). Expression intensities are displayed from white (low expression) to dark blue (high expression) while over-expressed miRNAs are indicated in red and under-expressend miRNAs are indicated in green; grey indicates missing data.
