
Figure 3. Identification of sncRNAs signature discriminating between normal and tumor samples.
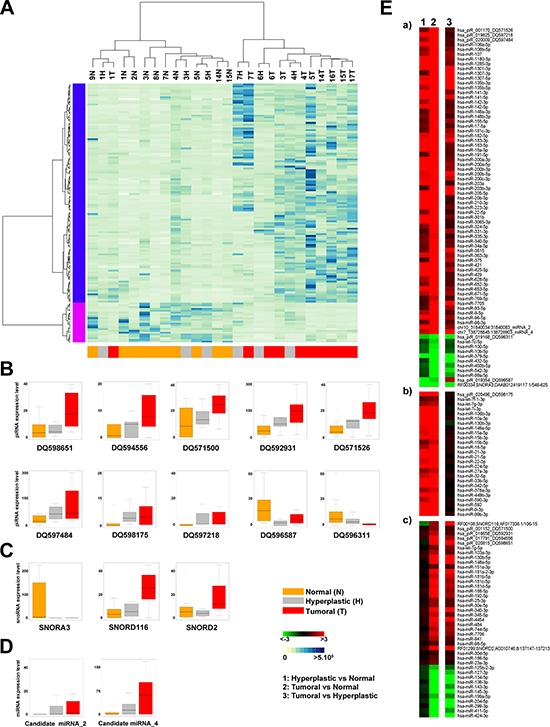
(A) Unsupervised hierarchical clustering of samples based on the expression level (RPM) of 142 sncRNAs (127 known miRNAs, 2 new miRNAs, 10 piRNAs and 3 snoRNAs) discriminating among normal (yellow), hyperplastic (grey) and tumor (red) samples (Kruskal-Wallis Test, p-Value <0.05). Each row corresponds to one sncRNA. BoxPlots showing the expression level (RPM) of 10 piRNAs (B), 3 snoRNAs (C) and 2 new miRNAs (D) identified in the signature. (E) Heatmaps showing fold difference values (ratio of mean RPM for each tissue: 1 = hyperplastic vs normal, 2 = tumor vs normal and 3 = tumor vs hyperplastic) of the sncRNAs identified in the signature. The sncRNAs are grouped as follows: (a) 83 showing a similar pattern of expression (b) 26 differentially expressed in both the hyperplastic and tumor compared to adjacent normal tissue, but not changing between hyperplastic and tumor tissues (c) 28 showing different trends.