
Figure 4. Ingenuity pathways analysis of Wnt/β-catenin Signaling.
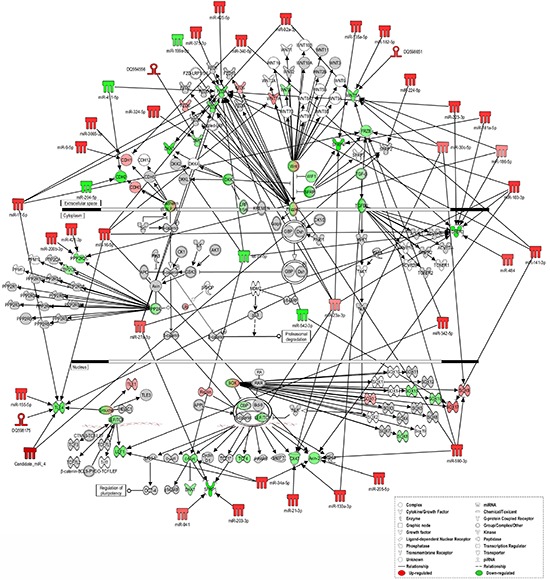
IPA of “sncRNA signature” and downstream targets involved in Wnt/β-catenin Signaling in tumor versus normal tissues. sncRNAs and mRNAs with significant increases in expression are shown in red, sncRNAs and mRNAs with significant decreases are shown in green, and which that were identified but did not change significantly are shaded in gray. Color intensity reflects the level of expression. Types of molecules are annotated in the legend in the box.