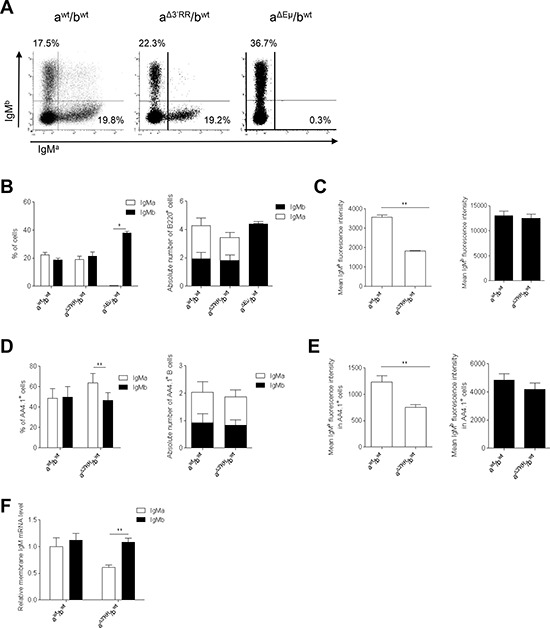
Figure 2. Expression of a 3′RR-deleted allele in bone marrow B cells.

(A) Flow cytometry analysis of IgMa and IgMb on B220+ bone marrow cells of heterozygous aΔ3′RR/bwt, awt/bwt and aΔEμMARs/bwt mice. One representative experiment out of ten is shown for aΔ3′RR/bwt and awt/bwt mice. One representative experiment out of four is shown for aΔEμMARs/bwt mice. Cells were gated on B220+ cells. (B) Percentages (left part) and numbers (right part) of B220+ bone marrow B cells expressing the a or b allele in aΔ3′RR/bwt, awt/bwt and aΔEμMARs/bwt mice. Mean ± SEM of ten aΔ3′RR/bwt mice, ten awt/bwt and four aΔEμMARs/bwt mice. Millions of bone marrow B cells are reported. *p < 0.05 (Mann-Whitney U-test). (C) IgMa and IgMb fluorescence intensity on B220+ B cells of aΔ3′RR/bwt and awt/bwt mice. Mean ± SEM of ten mice. **p < 0.01 (Mann-Whitney U-test). (D) Percentages (left part) and numbers (right part) of B220+AA4.1+ bone marrow B cells in aΔ3′RR/bwt and awt/bwt mice. Mean ± SEM of ten mice. **p < 0.01 (Mann-Whitney U-test). (E) IgMa and IgMb fluorescence intensity on B220+AA4.1+ bone marrow B cells in aΔ3′RR/bwt and awt/bwt mice. Mean ± SEM of ten mice. **p < 0.01 (Mann-Whitney U-test). (F) Real time PCR analysis of μ membrane transcripts in sorted B220+AA4.1+ bone marrow B cells of aΔ3′RR/bwt and awt/bwt mice. Values were normalized to GAPDH transcripts. Mean ± SEM of six mice. *p < 0.05 (Mann-Whitney U-test).
