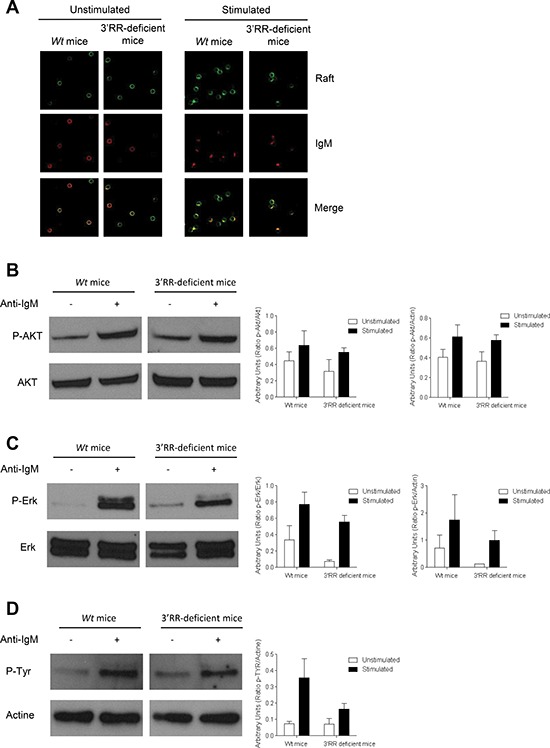
Figure 4. BCR signalling response in 3′RR-deficient B splenocytes.

(A) BCR and lipid rafts colocalization experiments. 3′RR deficient mice (aΔ3′RR/aΔ3′RR) and Sv/129 wt mice (awt/awt) were investigated. CD43− B cells were stained with cholera toxin Alexa 488 followed by stimulation with anti-IgM Alexa 594 labelled antibodies. Arrows point to areas where lipid rafts colocalise with membrane BCR. One representative experiment out of four is shown. (B) BCR signalling in 3′RR-deficient mice. CD43− splenic B cells (3 × 10⁶ cells/ml) from wt Sv/129 mice (awt/awt) and 3′RR-deficient mice (aΔ3′RR/aΔ3′RR) (were stimulated with 15 μg/ml of anti-IgM at 37°C for 10 min. Western Blot experiments were performed with 30 μg of proteins. Actin was used as an internal loading control. phosphor-Akt and Akt were investigated with specific anti-phosphor-Akt and anti-Akt antibodies, respectively. One representative experiments out of 3. Relative intensity of phosphor-Akt bands were related to Akt and actin bands (located in D). (C) phosphor-Erk and Erk were investigated with specific anti-phosphor-Erk and anti-Erk antibodies, respectively. One representative experiments out of 3. Relative intensity of phosphor-Erk bands were related to Erk and actin bands (located in D). (D) Total phosphor-Tyr was investigated with specific anti-phosphor-Tyr antibodies. One representative experiments out of 3. Relative intensity of phosphor-Tyr bands were related to actin bands. No significant differences for p-Akt, Akt, p-Erk, Erk and p-Tyr between 3′RR-deficient mice and wt mice (Mann-Whitney U-test).
