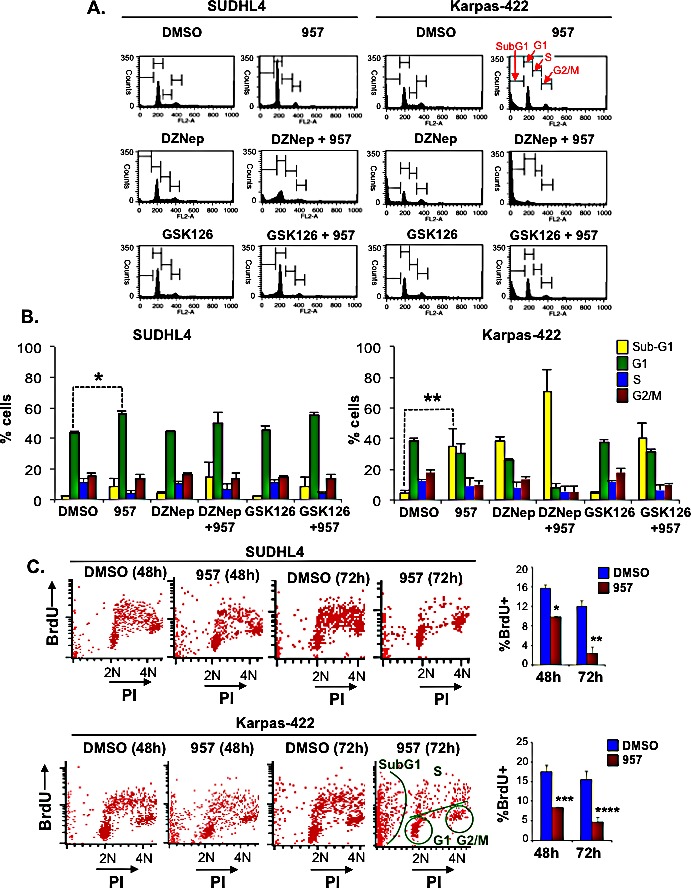
Figure 3. HDAC1,2 inhibition causes apoptosis in Karpas-422 cells and a G1 arrest in SUDHL4 cells.

A: SUDHL4 and Karpas-422 cells were treated with DMSO, 2μM ACY-957, 0.5μM DZNEP, 0.5μM GSK126 or a combination of drugs for 72h prior to cell cycle analysis by propidium-iodide staining. Representative plots from one experiment out of three independent experiments is shown in the figure. B: Quantitation of the cell cycle data in (A), compiled from three independent analyses. The graphs plot the average percentage of cells in each phase of the cell cycle. Error bars indicate to the standard error calculated from three independent experiments. *p=0.005; **p=0.0176. C: FACS analysis following BrdU-PI staining of Karpas-422 and SUDHL4 cells was performed following a 48h or 72h treatment with ACY-957. Representative plots from two independent experiments are shown in the figure. Quantitation of S-phase cells at 48h and 72h post ACY-957 treatment is also shown in the figure. *p= 0.01, **p=0.03, ***p= 0.03 and ****p= 0.02.
