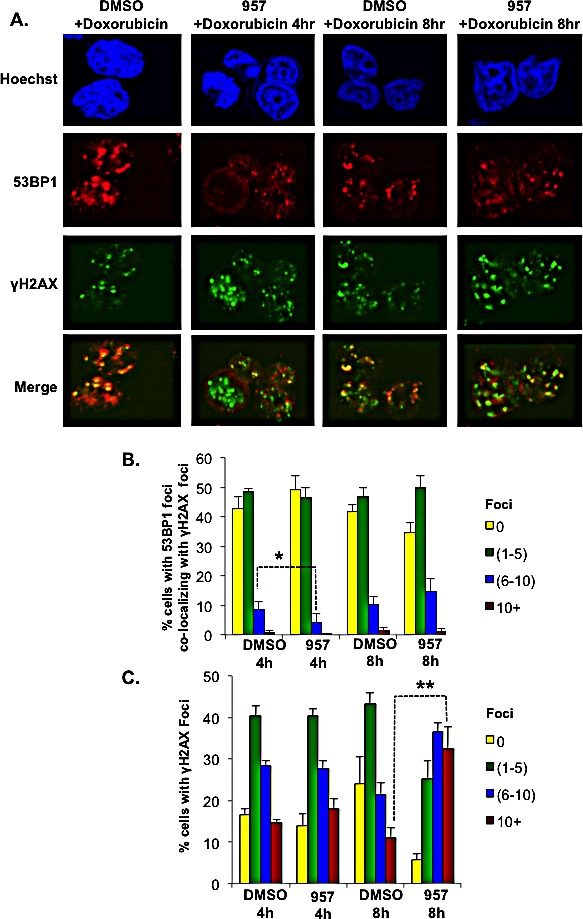
Figure 8. HDAC1,2 inhibition delays the kinetics of 53BP1 foci formation in refractory EZH2GOF DLBCL cells.

A: Karpas-422 cells were treated with either DMSO or 2μM ACY-957 for 24h before the addition of doxorubicin. After 4h or 8h of doxorubicin treatment, cells were fixed and immunofluorescence staining was performed with anti-γH2AX and anti-53BP1 antibodies. Cells shown are representative images based on the quantitation. B and C: Graphs depict the percentage of cells with 53BP1 foci present at γH2AX containing break sites and the percentages of cells with γH2AX foci. The data represents the average +/− standard error from four independent experiments. *p=0.05; **p=0.009. Merge is the overlay of γH2AX and 53BP1 pictures.
