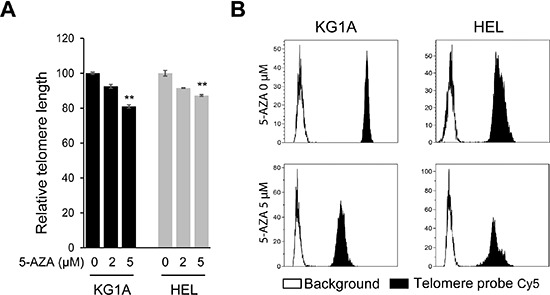
Figure 3. Telomere shortening in 5-AZA-treated AML cells.

(A) KG1A and HEL cells were treated with 5-AZA (2.0 and 5.0 μM, respectively) for 72 hours and telomere length was determined using FLOW-FISH. ** denotes P < 0.01. The values are means ± SD. (B) Shown are representative telomere signals as detected using FLOW-FISH. Three independent experiments were performed.
