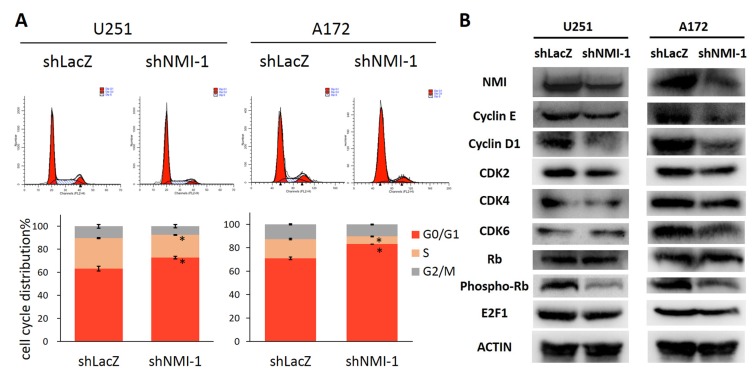
Figure 5. NMI regulates G1/S phase progression of glioma cell cycle.
(A) The cell cycle distribution of U251 (left panels) and A172 (right panels) glioma cells after depleting endogenous NMI expression. Error bars represent the SEM of the mean value. Statistical analysis was determined by two tailed student's t-test. *, P<0.05. (B) The effects of NMI depletion on cell cycle related proteins in the G1/S transition were determined by western blot analysis. ACTIN served as a loading control.

