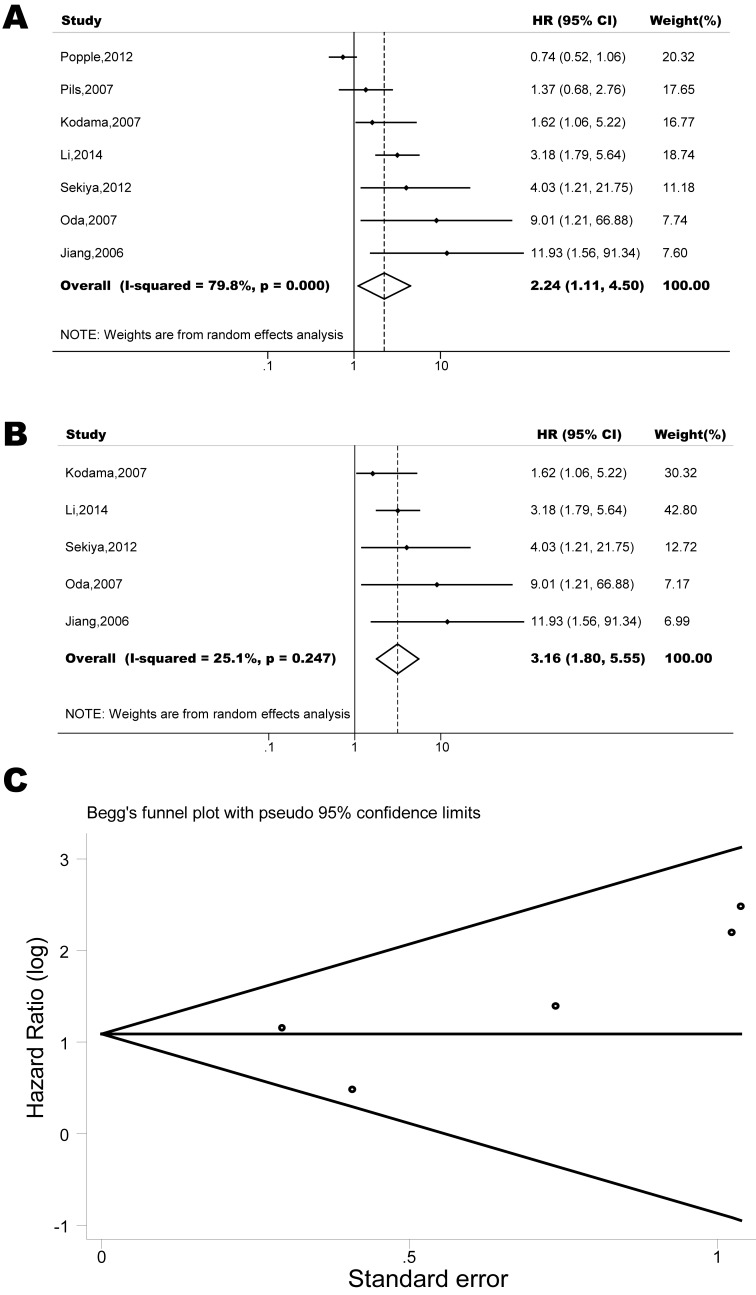
Figure 17. Forest plots show association between CXCR4 over-expression and OS in gynecologic cancer.
(A) Summary for all seven trials, the estimates is 1.32(1.03-1.71) using fixed effects model. (B) Excluding two studies (Popple, 2012; Pils, 2007) yield results without significant heterogeneity. The estimate is 3.00(1.85-4.55) using fixed effects model. (C) Funnel plots showing association of CXCR4 and OS in gynecologic cancer. Visual inspection of the Begg funnel plot did not identify substantial asymmetry.

