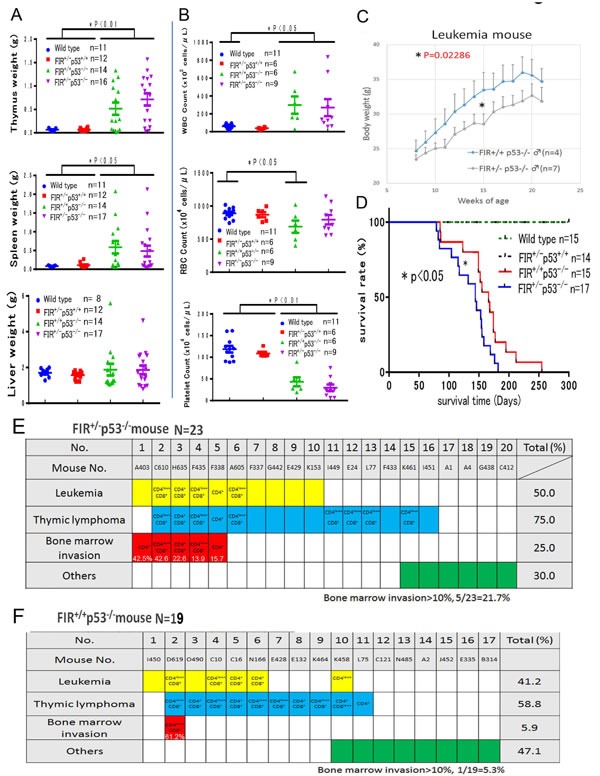
Figure 4. Summary of organs' weight and blood tests, body weight and overall survival of curves of FIR−/−P53+/+, FIR+/−P53+/+, FIR+/+P53−/−, and FIR+/−P53−/− mice.

(A) The weight of thymus of FIR+/−P53−/− and FIR+/+P53−/− was significantly heavier than that of wild or FIR+/−P53+/+ mouse (P<0.05). The weight of spleen of FIR+/+P53−/− -were significantly heavier than that of wild or FIR+/−P53+/+ mouse (P<0.05). The weight of liver of wild mouse, FIR+/−P53+/+, FIR+/+P53−/−, and FIR+/−P53−/− was no significant difference. (B) WBC count of FIR+/−P53−/− and FIR+/+P53−/− was significantly increased than that of wild mouse. RBC count of FIR+/+P53−/− was significantly less than that of wild mouse (P<0.05). Platelet count of FIR+/−P53−/− and FIR+/+P53−/− was significantly less than that of wild or FIR+/−P53+/+ mouse (P<0.05). (C) Body weight of FIR+/−P53−/− mice was significantly lighter than that of FIR+/+P53−/−. Statistical signifincace was calculated by Student's t-test. (D) The overall survival curves of four genetically different group: wild, FIR+/−p53+/+, FIR+/−p53−/−, and FIR+/+p53−/− mice. FIR+/−p53+/+ and FIR+/+p53+/+ were survived 100% up to 25 weeks after birth without obvious tumor formation, body weight loss or other physical disabilities. On the contrary, the overall survival curves (Kaplan-Meier method) of FIR+/−p53−/− and FIR+/+p53−/− mice were declined around 70 days after birth. Overall survival curves of four genetically different group: wild, FIR+/−p53+/+, FIR+/−p53−/−, and FIR+/+p53−/− mice were compared by log-rank test. (E) T-ALL with more than 10 % bone marrow infiltration of blast cells in FIR+/−P53−/− mice was 5 out of 23 (21.7%) including three pre-analytical alive mouse in FIR+/+P53−/− (1 out of 19=5.3%) including two pre-analytical alive mouse. (F) In FIR+/−P53−/− mice (N=23), T-ALL: 10 (50.0%), thymic lymphoma: 15 (75%), bone marrow invasion: 5 (25.0%). Whereas in FIR+/+P53−/− mice (N=17) T-ALL: 7 (41.2%), thymic lymphoma: 10 (58.8%), bone marrow invasion: 1 (5.9%). Blank in colored column indicated undetermined or not tested for cell surface marker.
