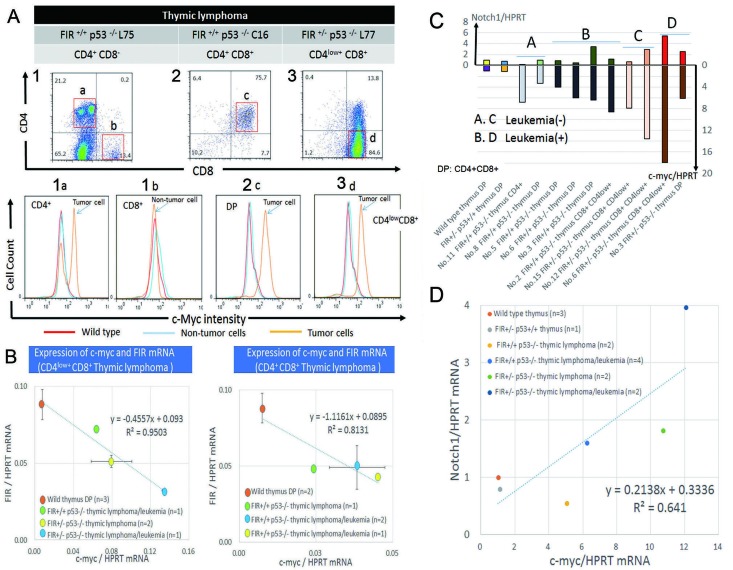
Figure 6. c-Myc protein is enhanced and showed inverse correlation with FIR in thymic lymphoma cells and promotes bone marrow invasion.
(A) Flow cytometry of thymic lymphoma cells in FIR+/+P53−/− or FIR+/−P53−/− mice are indicated. CD4+ cells of FIR+/+P53−/− (upper column 1) has two populations indicated c-Myc-high (1a) and c-Myc–low intensity (1b). Notably, c-Myc-high (1a) population, presumably lymphoma cells, has c-Myc-low peak, indicating non-tumor cells cluster. CD4+CD8+ cells (2c) also indicated c-Myc-high intensity population. CD4low+CD8+ (3d) showed c-Myc-high intensity population indicated by FACS (bottom). Red line: Thymus cells of wild type FIR+/+P53+/+ mouse. Thin blue line: non-tumor cells of FIR+/+P53−/− or FIR+/−P53−/− mice. Orange line: Tumor cells of FIR+/+P53−/− or FIR+/−P53−/− mice. (B) Inverse correlation with significance between c-myc and FIR mRNA expression in CD4low+CD8+ or CD4+CD8+thymus lymphocytes obtained from FIR+/+P53−/− or FIR+/−P53−/− mice. Relative c-myc (or FIR)/HPRT mRNA expression of CD4low+CD8+ thymic lymphoma/leukemia cells of FIR+/+p53−/− (light green) was 8.6 (0.81), thymic lymphoma cells of FIR+/−p53−/− (yellow) was 10.7 (0.58), and thymic lymphoma/leukemia cells of FIR+/−p53−/− (blue) was 18.0 (0.37) times as compare to thymic cells of wild mouse (dark orange), respectively (right). The relationship between c-myc/HPRT mRNA (x-axis) and FIR/HPRT mRNA (y-axis) was y=-0.4557x+0.093 (R2=0.9503). Relative c-myc (or FIR)/HPRT mRNA expression of CD4+CD8+ thymic lymphoma cells of FIR+/+p53−/− (light green) was 3.3 (0.56), thymic lymphoma/leukemia cells of FIR+/+p53−/− (yellow) was 6.1 (0.48), and thymic lymphoma/leukemia cells of FIR+/+p53−/− (blue) was 5.2 (0.56) times as compare to thymic cells of wild mouse (dark orange), respectively. The relationship between c-myc/HPRT mRNA (x-axis) and FIR/HPRT mRNA (y-axis) was y=-1.1161x+0.086 (R2=0.8131). (C) (D) c-myc mRNA and Notch1 mRNA expression was positively correlated each other in sorted thymic lymphoma cells extracted from mice of different genetic backgrounds.

