
Figure 1. Melanoma subtypes identification by class discovery in the CCLE dataset.
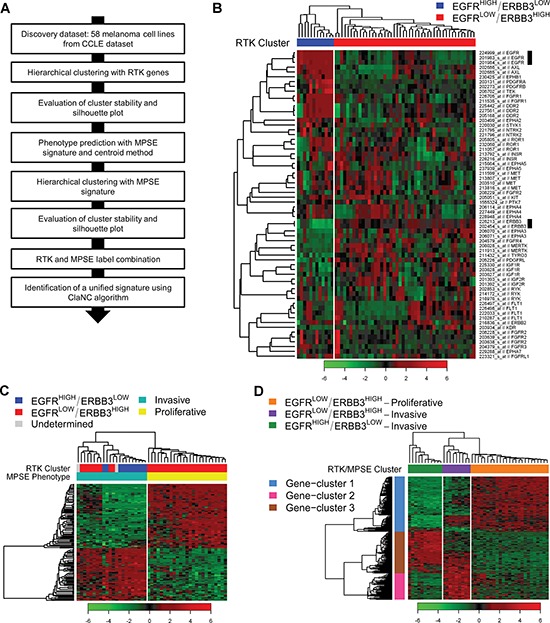
(A) Workflow of bioinformatics analysis. (B) RTKs expression of 58 melanoma cell lines grouped by hierarchical clustering. Samples are separated in two major clusters named EGFRHIGH/ERBB3LOW (blue) and EGFRLOW/ERBB3HIGH (red). Black bars highlight EGFR and ERBB3 probe sets. (C) Hierarchically clustered heatmap showing the expression of MPSE genes in the 47 samples with a defined phenotype: light green, Invasive; yellow, Proliferative. RTK labels are shown for comparison. (D) Heatmap of the hierarchical clustering using the RTK/MPSE signature: EGFRHIGH/ERBB3LOW-Invasive (green); EGFRLOW/ERBB3HIGH-Invasive (violet); EGFRLOW/ERBB3HIGH-Proliferative (orange). The number of clustered samples, as detailed in the text, is forty-five. The 210 genes of the RTK/MPSE signature are grouped into three highly correlated clusters: 1, light-blue; 2, pink; 3, brown.